
Figure 1.
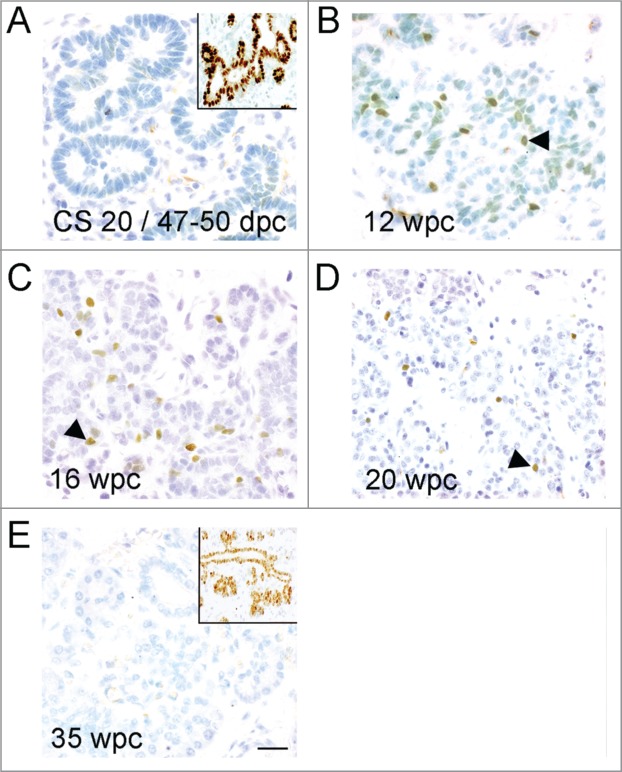
Profile of immunohistochemistry for NEUROG3 during human development. (A–E) Brightfield images show NEUROG3 in brown counterstained with toluidine blue. Insets (A) and (E) show brown SOX9 staining in nearby sections from the same fetus. Arrowheads exemplify positively stained cells. Scale bar represents 50 μm in all panels.