
Figure 2.
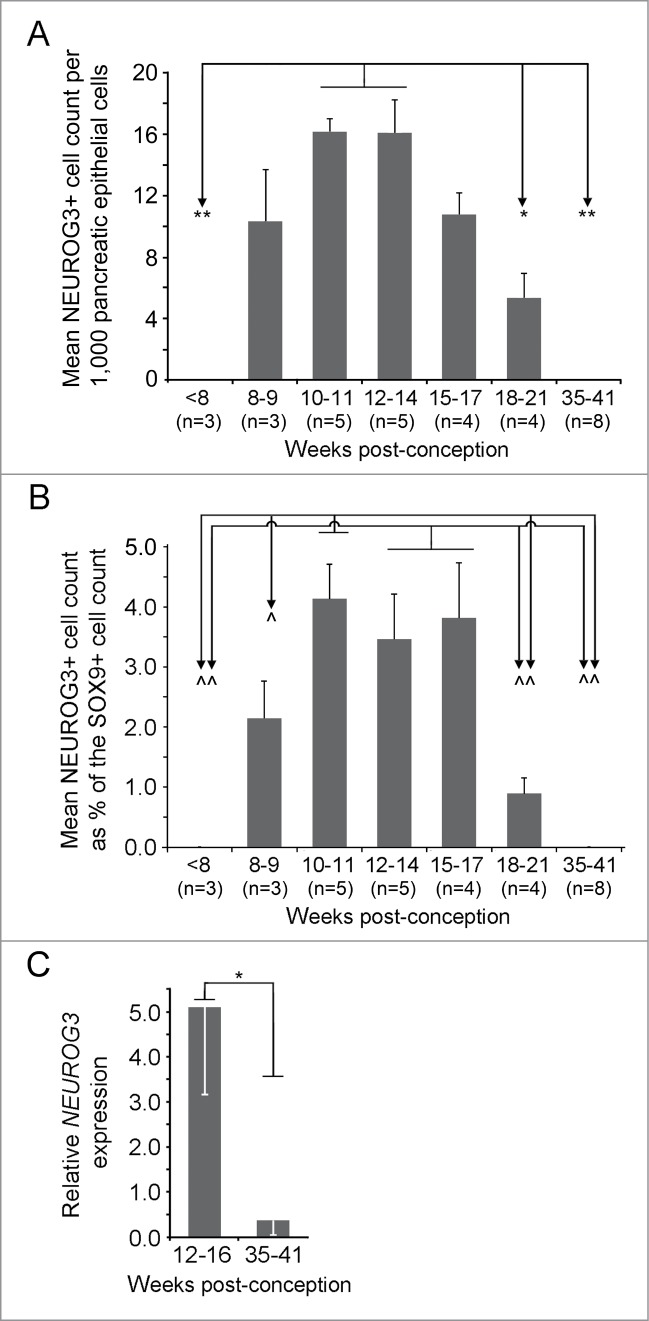
Quantification of NEUROG3 by cell-counting and mRNA analysis during human fetal development. (A) and (B) The NEUROG3 count was quantified relative to the total pancreatic epithelial cell population (A) and the SOX9-positive cell population (B). By either approach the NEUROG3 count at 10-11 wpc and at 12–14 wpc were statistically greater than at <8 wpc, 18–21 wpc and 35–41 wpc. When quantified relative to the SOX9-positive cell population, 10-11 wpc, 12–14 wpc and 15–17 wpc emerged as the period of peak NEUROG3 detection. In neither (A) nor (B), was there a significant difference between counts at 10–11, 12–14 and 15–17 wpc. *P < 0.05, **P < 0.01, ^P < 0.005, ^^P < 0.0001 by one-way ANOVA with post-hoc Tukey's test. The number of specimens in each group (n) is shown in parentheses. (C). Relative NEUROG3 expression by qRT-PCR demonstrated higher levels in samples from 12–16 wpc than at 35–41 wpc. *P < 0 .01 by 2-tailed unpaired Student's t-test.