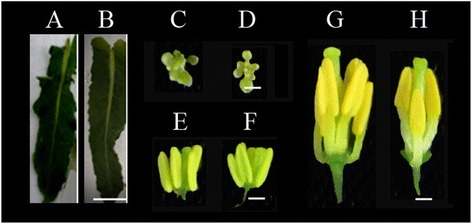
Figure 2.

Photographs of the leaves and developmental anthers for microarrays from the mock-treated (A, C, E, G) and MES-treated (B, D, F, H) plants. A-B, young leaves from the main inflorescences (Ls); C-D, small buds (SBs); E-F, anthers from middle buds (An-MBs); G-H, anthers form large buds (An-LBs). Scale bar in leaves was 1 cm, scale bars in SBs, An-MBs, and An-LBs were 1 mm.
