Figure 3.

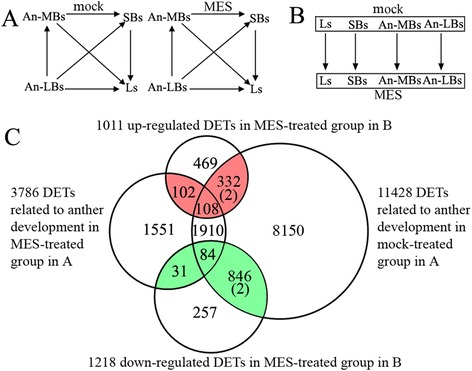
Strategies for identification of differentially expressed transcripts (DETs) involved in microgametogenesis between the MES-treated and mock-treated plants by two sets of student’s t-test comparisons. (A) Comparisons within groups. The pair-wise comparisons of Student’s t-test between tissues (organs) were carried out within mock-treatment groups and MES-treatment groups, respectively, to detected DETs related to anther development under mock-treatment (control, fertile) and MES-treatment (male sterile) conditions. The criteria for screening DETs were p-value <0.001 and fold change ≥ 2. mock, mock-treatment; MES, MES-treatment; (B) Comparisons between the MES-treated and mock-treated groups. The pair-wise comparisons of Student’s t-test were performed between the corresponding tissues (organs) of the mock-treated group and the MES-treated group to identify DETs related to MES-treatment. The screen criteria were same as above. (C) Venn diagram showing the DETs involved in microgametogenesis between the MES-treated and mock-treated groups. Comparisons within groups produced two sets of DETs, development-related genes in the MES-treated plants and in the mock-treated plants (the left and right cycles). Comparisons between groups also produced two sets of DETs, up-regulated genes and down-regulated genes in MES-treated group (the up and down cycles). These four sets of DETs were all collected, respectively. The common sections (totally 1501 unique DETs, the red and green parts, (2) indicates 2 DETs existing in the both data sets) were considered to be anther development-related genes affected by MES-treatment.
