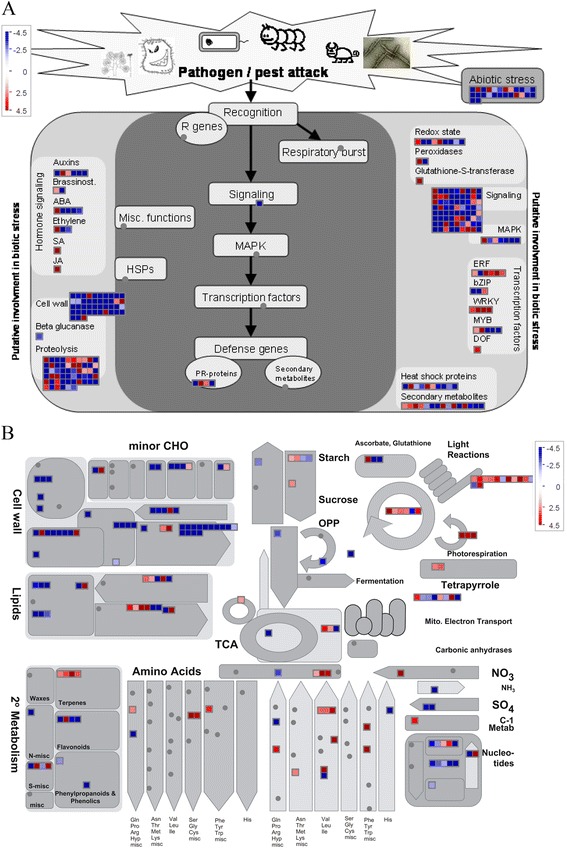
Figure 5.

Transcripts involved in stress (A) and metabolism (B) assigned by MapMan in rapeseed leaves and developmental anthers treated by MES. Positive fold change values (red) indicate up-regulation, whereas negative fold change values (blue) denote down-regulation. Color saturates at 4.5-fold change. Each square represents a differentially expressed transcript.
