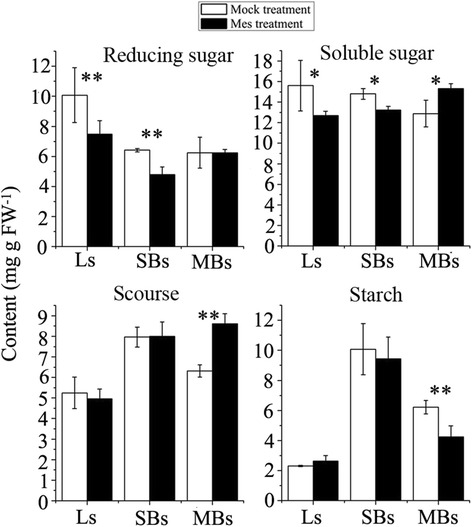
Figure 6.

Comparison of carbohydrate content between mock-treated and MES-treated plants. Ls, young leaves from the main inflorescences; SBs, small buds with length less than 1 mm; MBs, middle buds with length of 1–3 mm in. *, **, represents significant difference at 0.05 level and at 0.01 level, respectively.
