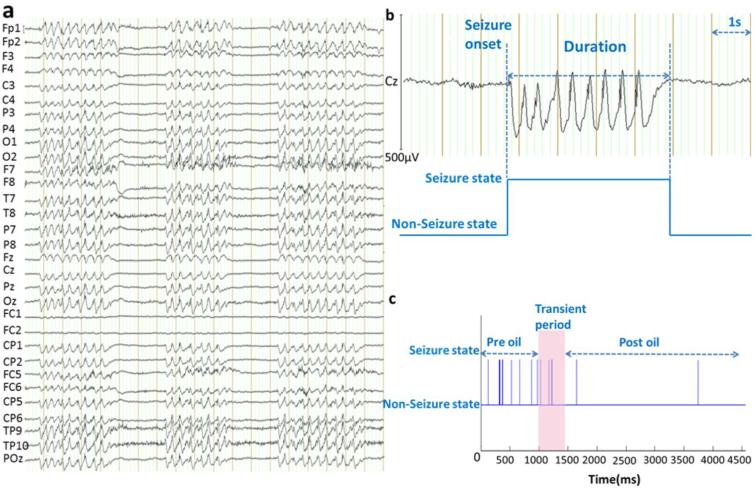
Figure 3. EEG-captured spike-wave seizures in G1D patients.
(a) An example segment of EEG recording containing three spike-wave seizure periods. Electrode position followed standard abbreviated nomenclature. Vertical bars: 1 s. (b) Illustration of the identification of seizure duration. (c) The seizure-nonseizure binarized time course of a representative subject: Spike-wave periods are represented as bar plots against EEG time course in the setting of a non-seizure baseline state. Triheptanoin (oil) administration is marked as a pink bar in (c).

