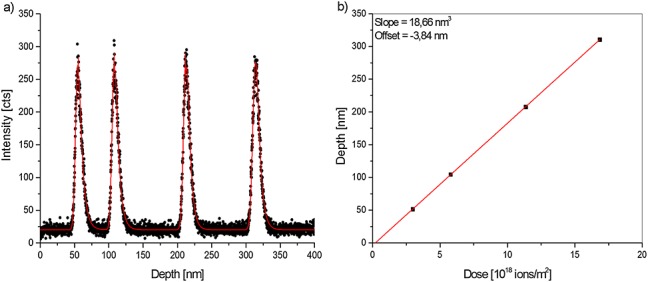
Figure 2.

Typical depth profile of the ONA reference material showing the [Alq3 + H]+ secondary ion intensity (black dots) and a fit with four summed Dowsett response functions (red line); b) corresponding plot of the known central depth of each Alq3 layer against the sputter dose required to reach the maximum [Alq3 + H]+ secondary ion intensity (black squares) and the linear fit to the data (red line).
