Figure 6.

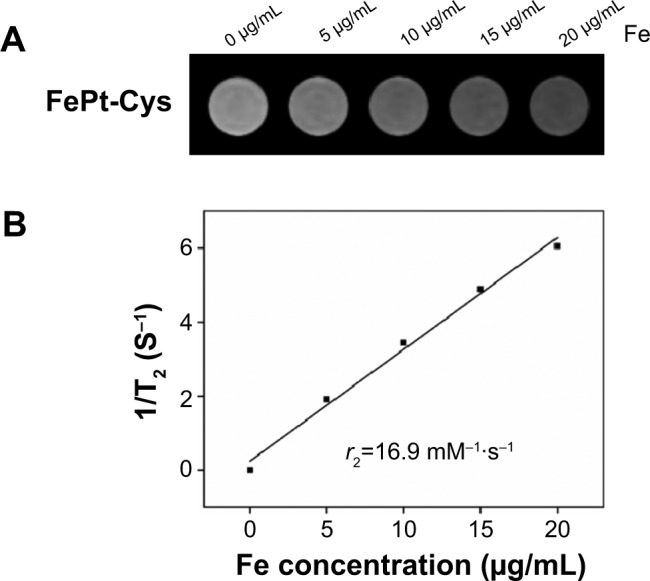
MR contrast imaging of FePt-Cys NPs.
Notes: (A) The T2-weighted MR images of FePt-Cys NPs at different Fe concentrations. (B) T2 relaxation rates (1/T2) plotted against the Fe concentration of FePt-Cys NPs.
Abbreviations: FePt-Cys, l-cysteine coated FePt; MR, magnetic resonance; NPs, nanoparticles; r2, relaxation rate.
