
FIGURE 2.
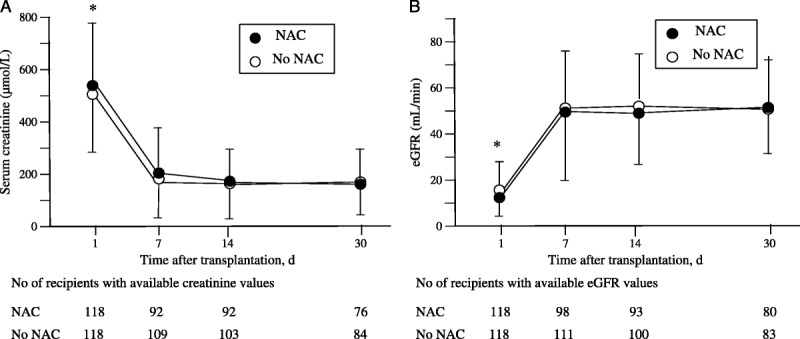
Time course of serum creatinine (A), eGFR (B) in the first month after renal transplantation assessed at days 1, 7, 14, and 30. Data markers represent the mean and the error bars, SD. Numbers of values at days 7, 14, and 30 were smaller than the number of recipients because of missing data and of patients discharged from hospital. A, The two-way analysis for repeated measurements showed that the factor time was significant (P < 0.0001), whereas both the factor group and the interaction between group and time were not significant (respectively, P = 0.653 and P = 0.472). *P < .0001 day 1 vs. days 7, 14, and 30 in both groups (post hoc analysis F Scheffe test). B, eGFR was calculated using the MDRD formula.39 The two-way analysis for repeated measurements showed that the factor time was significant (P < 0.0001), whereas both the factor group and the interaction between group and time were not significant (respectively P = 0.826 and P = 0.531). MDRD, Modification of the Diet in Renal Disease; eGRF, estimated glomerular filtration rate; SD, standard deviation.