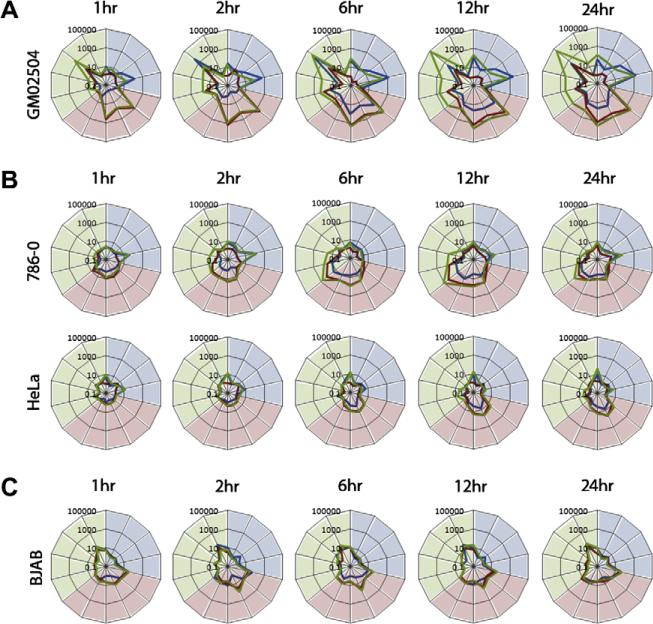
Fig. 3.
The inability of transformed cells to respond to TNF plus IFNβ is not due to altered kinetics. Cells (1 × 10⁶) were plated in each well of a six well dish. The following day cells were either mock treated or treated with TNF, IFNβ, or TNF plus IFNβ. At each indicated time point, cells were harvested and frozen. After all time points were collected, RNA was extracted and used for synthesis of cDNA. rtPCR was then used to measure the response of each cell to each treatment at each time point. Each graph depicts the fold induction compared to mock of 14 chosen marker genes in response to TNF (blue line), IFNβ (red line), or TNF plus IFNβ (green line). Marker genes are (clockwise from top): (induced by TNF and shaded in blue) BIRC3, CCL2, CXCL5, IL8, (induced by IFNβ and shaded in red) ISG15, ISG54, IFIT1, IFIT2, OAS1, (induced by TNF plus IFNβ and shaded in green) INDO, GBP4, CXCL10, VCAM1, and CCL5.

