
Fig. 3.
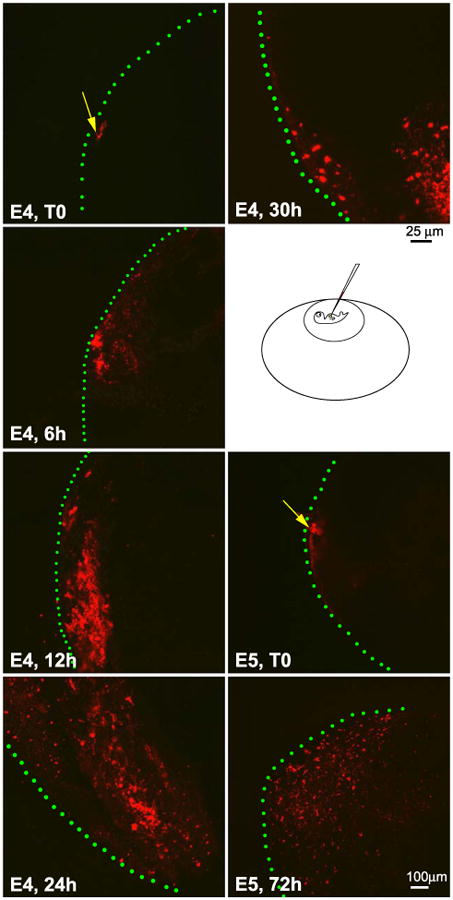
Use of DiI labeling to trace the lineages of cells in the localized growth zones. E4 and E5 embryo livers were labeled with lipophilic-fluorescent dye DiI and the livers were isolated at specified time points. Specimens were collected at time zero (T0), 6, 12, 24, 30, and 72 h, respectively. The liver specimens were observed with a confocal microscope. The pictures represent the maximum projection, in which all the planes (X, Y, and Z) are combined by computerization. Injection sites were marked with a yellow arrow and the surface of the liver lobe with green lines. As time progresses, labeled cells become more widely and inwardly distributed. Note that a few labeled cells remain at the injection site. Size bar is 25 μm for E4 and 100 μm for E5. The microinjection diagram was not drawn to scale.