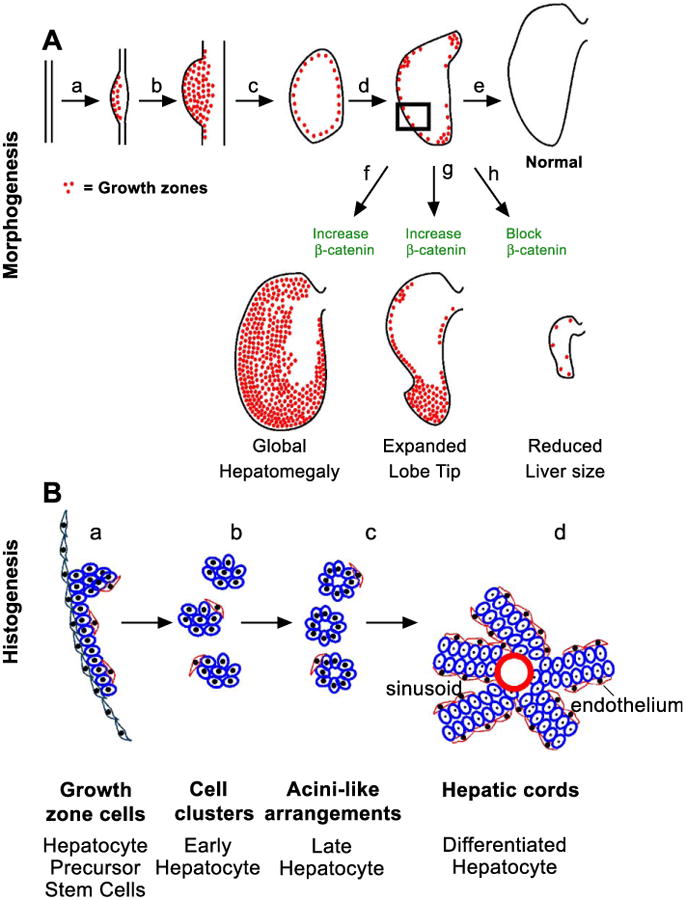
Fig. 8.

β-catenin in the morphogenesis and histogenesis of the liver. (A) Morphogenesis. Schematic showing the distribution of β-catenin corresponds to the LoGZ. β-Catenin expression was up-regulated where the liver was induced at E2 (a), increased throughout the liver bud at E4 (b), shifted to the periphery at about E6 (c), and then became restricted to specific growth zones at about E8 (d). The strategic location of LoGZ can influence the shape and size of the liver (e). Elevated expression of β-catenin leads to overall enlarged livers (f) or an expanded growth tip (g, less frequency). Blocking β-catenin activity leads to a reduction in size of the liver (h). (B) Histogenesis. Schematic diagram shows the arrangement of hepatocytes and precursors (blue color) from the periphery to the center of the liver (in the indicated rectangular area from A). At the periphery in the LoGZ, the proliferating hepatocyte precursors are not yet organized and are flanked by an outside layer of flat layer cells (green) and an inside layer of mesenchymal cells (red color) (a). At stage b, cell clusters begin to form and are organized into acini in the subperipheral area (c). Toward the center the liver, the hepatocytes are organized into hepatic cords and the cords are sandwiched by endothelial cells (d).
