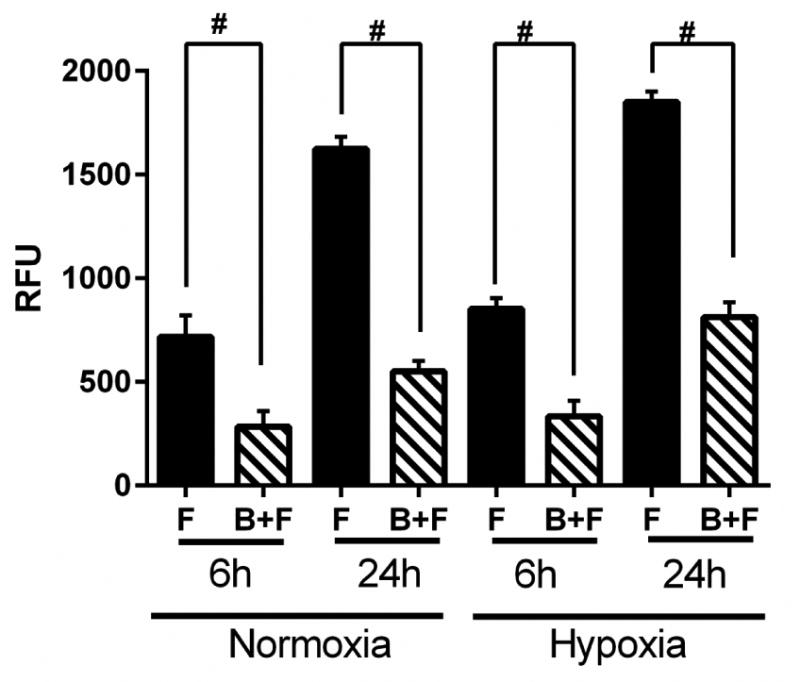
Figure 3.

Differential migration of fibroblasts in fibroblasts in contact with BOEC (B + F), fibroblasts (F) alone, and BOEC (B) alone during different lengths of hypoxia. Two-way ANOVA followed by Student t-test with post hoc Bonferroni's correction was performed. Significant difference from control value was indicated by #P < 0.0001.
