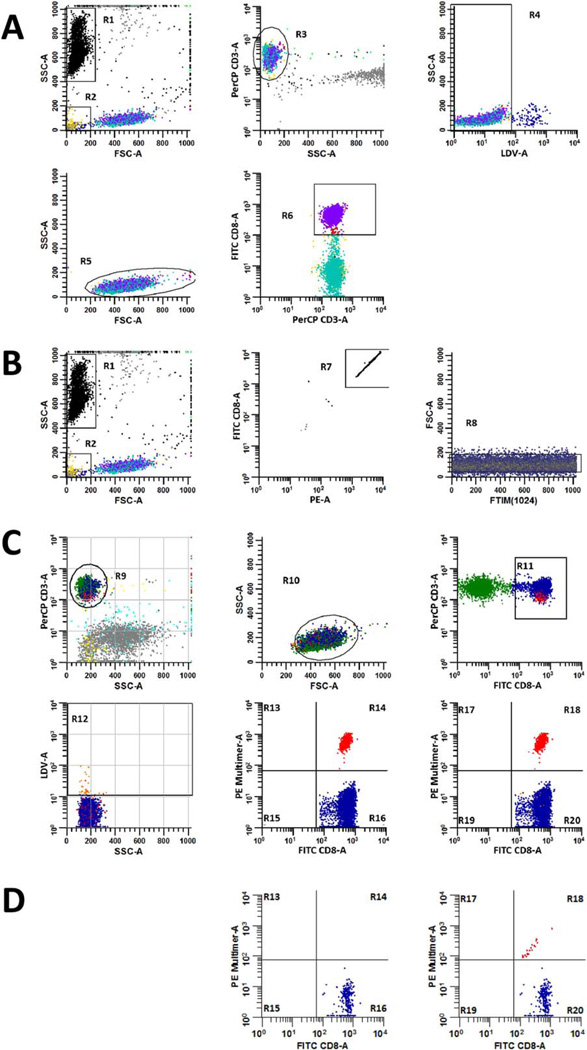
Fig. 1.
Gating strategies for measuring the absolute number of CD3+/ CD8+ cells µl−1 and the percentage of multimer positive events in peripheral blood samples. The absolute number of CD3+/CD8+ T cells µl−1 in each sample was calculated according to Formula 1 using data derived from the ‘CD8 Count’ tube (A and B). To accomplish this, the number of CD3+/CD8+ events acquired by the flow cytometer (A) was compared to the number of enumeration beads that were also acquired, which were used to determine the fraction of the original sample volume that was collected (B). The acquired number of CD8+ T cells was determined by excluding enumeration beads (R1) and debris (R2) events from the analysis, employing a plot of FSC-A versus SSC-A to resolve these populations. CD3+ events (R3) were identified on a gated plot (NOT R1 and NOT R2) of SSC-A versus PerCP CD3-A, and then a gated plot (NOT R1 and NOT R2 and R3) of LDV-A versus SSC-A was used to identify viable T cells (R4). A gated plot (NOT R1 and NOT R2 and R3 and R4) of FSC-A versus SSC-A was used to discriminate viable, CD3+ T cells that harbored scatter characteristics of lymphocytes (R5). Finally, a gated plot (NOT R1 and NOT R2 and R3 and R4 and R5) of PerCP CD3-A versus FITC CD8-A was used to quantify the number of CD3+/CD8+ T cells (R6) that were acquired from the sample. Thereafter, bead events (R1) were identified on a plot of FSC-A versus SSC-A and were further discriminated from non-bead events by virtue of their high fluorescence intensity (R7) on an R1-gated plot of PE-A versus FITC CD8-A. Single bead events were refined and identified (R8) on a gated plot (R1 and R7) of event chronology (FTIM(1024)) versus FSC-A to assess the compositional homogeneity of acquired beads. The fraction of CD8+ cells that were CAST positive was established in ‘Dextramer’, ‘Tetramer’, ‘Negative Control,’ or ‘FMO’ tubes according to the gating strategy defined in (C). To measure these percentages, CD3+ events were identified on a plot of SSC-A versus PerCP CD3-A (R9), which were then further refined on an R9-gated plot of FSC-A versus SSC-A. CD3+ events having lymphocyte scatter characteristics (R10), were then displayed on a gated plot (R9 and R10) of FITC CD8-A versus PerCP CD3-A, where CD3+/CD8+ T cells were identified (R11). Dead cells (R12) were excluded from the analysis via a gated plot (R9 and R10 and R11) of SSC-A versus LDV-A. Finally, gated plots (R9 and R10 and R11) of FITC CD8-A versus PE Multimer-A that either excluded (R13–R16) or included (R17–R20) dead cells were used to measure the percentage of multimer positive (R14 or R18) events amongst total gated CD3+/CD8+ events. When samples are of good quality or when CAST frequencies are high, the effect of dead cell exclusion may not be readily apparent; however, dead cell exclusion is particularly beneficial when sample viability is sub-optimal or when CAST frequencies are low. Bivariate histograms of FITC CD8-A versus PE-Multimer-A from a separate, multimer-negative sample are gated as described in (C) to demonstrate how dead cell exclusion reduces false positive detection in such cases (D).

