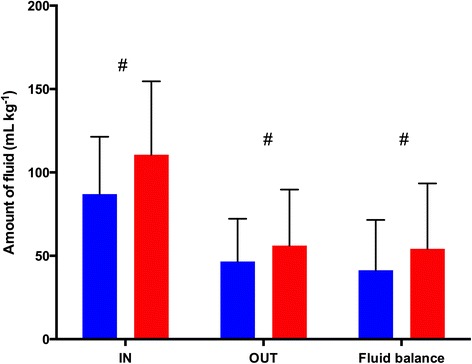
Figure 2.

Difference in fluid balance between groups. Red bars represent the human albumin group, and blue bars represent the hydroxyethyl starch group. Data are mean ± standard deviation. #P <0.001. IN, Total fluid volume administered intraoperatively, including cardiopulmonary bypass prime volume, cardioplegia volume and all fluid administered with drugs and flushes of invasive pressure lines; OUT, Total fluid output, including blood loss, urine output and amount of ultrafiltration.
