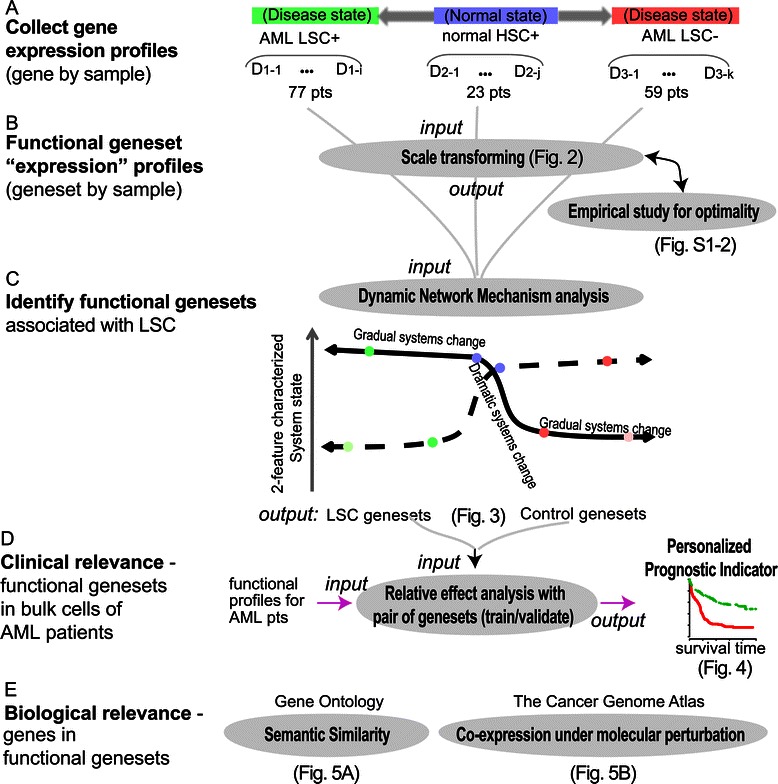
Figure 1.

Flowchart of normalization and analysis of pooled molecular function profiles. Panel A) Collection of gene expression profiles. Datasets (D) of Acute Myeloid Leukemia (AML) positive or negative (1 and 2 respectively) for Leukemia Stem Cell (LSC), and of normal Hematopoietic Stem Cells (HSC) (3). Panel B) Calculation of gene-set profiles. Panel C) Identification of functional gene-sets associated with LSCs using the dynamic network mechanism analysis. A cartoon shows that different features characterize the dramatic systems stage changes in different ways. Panel D) Evaluation of clinical relevance in primary AML samples. Panel E) Evaluation of biological relevance using independent data resources.
