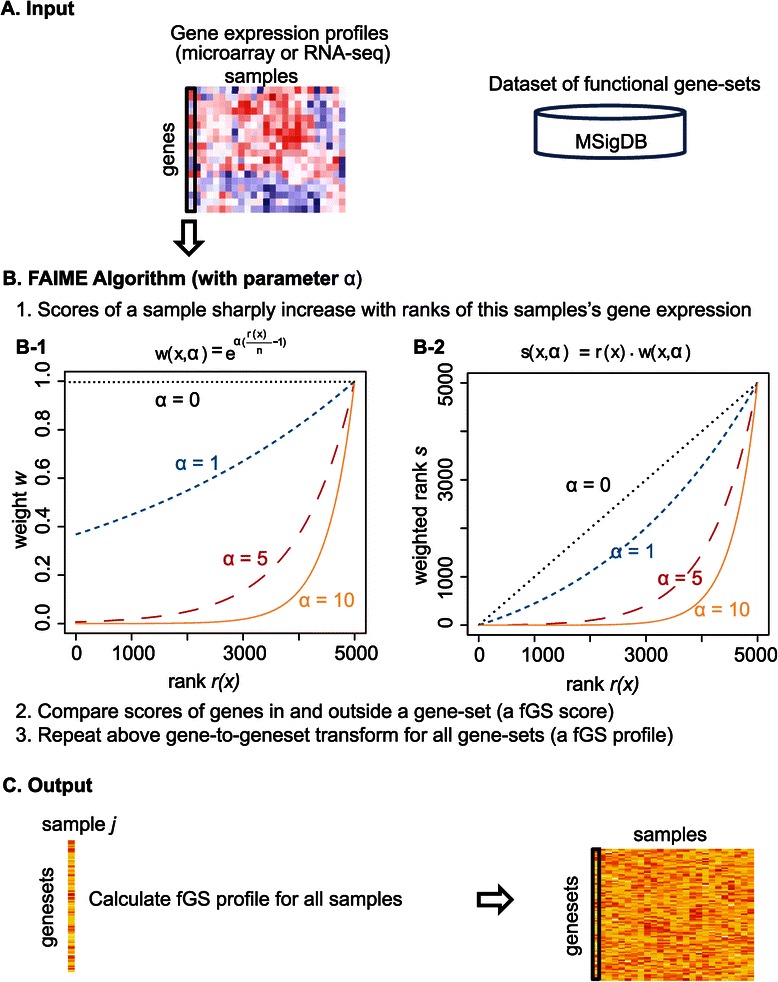
Figure 2.

FAIME algorithm with a new parameter α outline. Panel A) The input for the FAIME algorithm is either a gene expression matrix in the form of log2 microarray expression values or RNA-seq counts, and a database of gene-sets. Panel B) Mechanism (or gene-set) score is defined as the difference between the scored expression of genes inside and outside a previously defined gene-set. B-1) Applying an increasingly larger α to the FAIME method. The weight (y-axis) is an exponential function of gene expression ranks (x-axis) adjusted by the parameter α. B-2) Weight-dependent qualitative scores sharply increase with gene rank. The score (y-axis) is the product of gene expression ranks (x-axis) and the rank’s weight adjusted by the parameter α. In each panel, the more highly expressed genes are ranked higher on the x-axis. The dashed line represents the score obtained with no weighting (i.e., ranking only). Panel C) Output of the algorithm as a matrix containing mechanism scores for each gene-set and sample.
