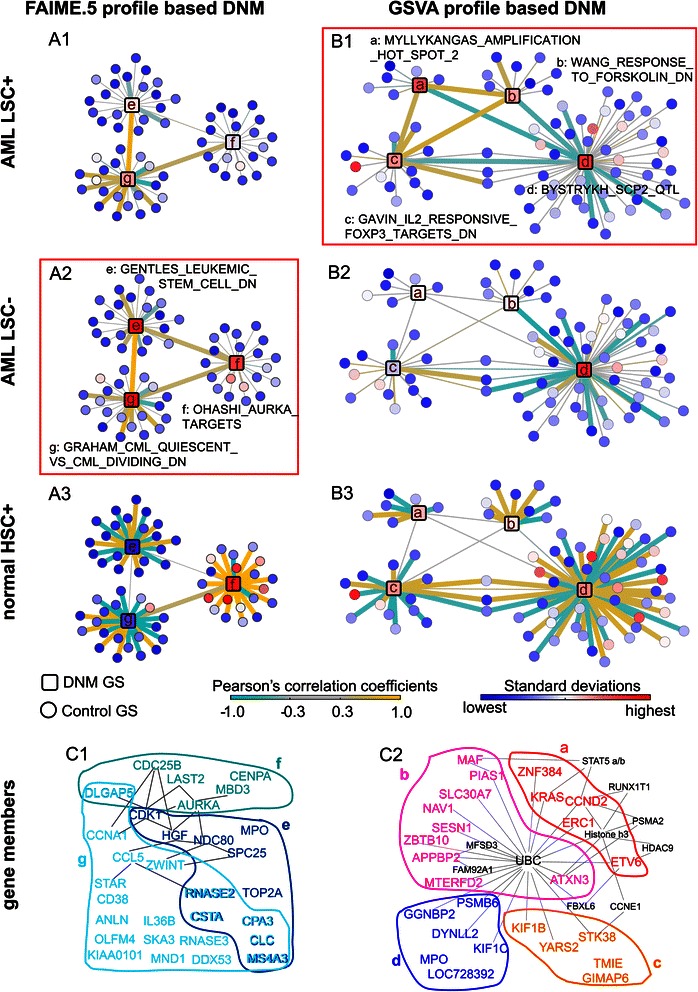
Figure 3.

Dynamic Network Mechanism (DNM) analysis on functional gene-sets (gene-sets). Panel A) Network resulting from FAIME.5 profiles; Panel B) Network resulting from GSVA profiles. Each panel visually illustrates dynamics of the identified DNM gene-sets in each of the three sorted cell groups (1: AML LSC +, 2: AML LSC-, and 3: normal HSC+). Node color codes the standard deviation of a gene-set in the corresponding sample group, while line color codes the Pearson’s correlation coefficients between any two gene-sets. DNM gene-sets are represented as labeled squares and control gene-sets are represented as circles. The identified critical sample group for each analytical method is boxed in red (A1, B2). Line weight increases with correlation (>0.5 in Panel A and >0.4 in Panel B). Panel C) The colored groups of gene-members (a, b, c, d) or (e, f, g) corresponding to the above red-boxed DNM gene-sets respectively. The grey lines represent their pair-wise associations according to the Ingenuity knowledge database. Additional genes (black) that interacted with two or more identified genes in the Ingenuity database are also displayed.
