Figure 5.

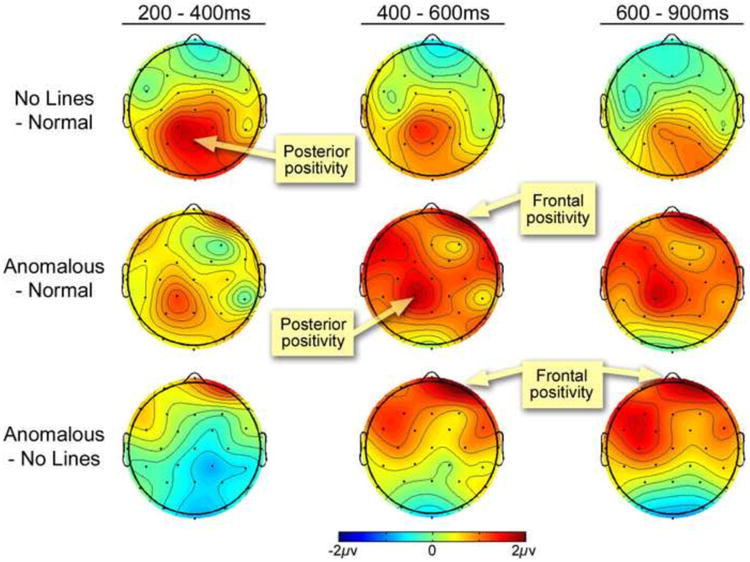
Voltage maps for the differences across the scalp surface of ERPs evoked by contrasts between panels with Normal Lines, No Lines, and Anomalous Lines for the 200-400 ms, 400-600 ms, and 600-900ms time windows.

Voltage maps for the differences across the scalp surface of ERPs evoked by contrasts between panels with Normal Lines, No Lines, and Anomalous Lines for the 200-400 ms, 400-600 ms, and 600-900ms time windows.