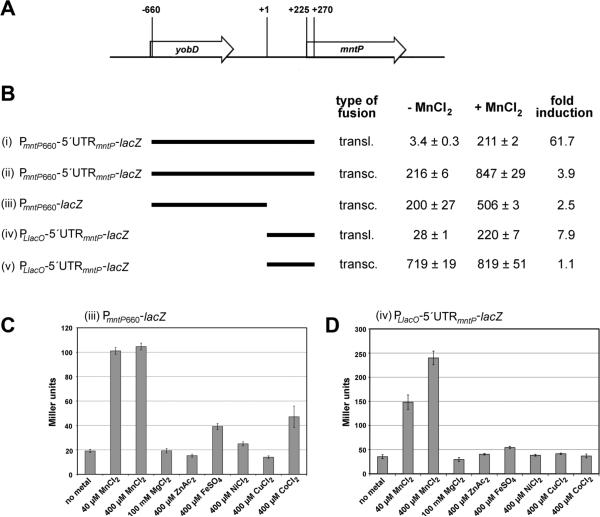
Figure 1. Transcription and translation of mntP are induced by MnCl2.
(A) Diagram of the yobD-mntP region. The numbering is as follows: +1 is the transcription start site, +225 corresponds to the AUG start codon, +270 shows the position of the fusion to the 15th amino acid.
(B) β-galactosidase activity for strains carrying chromosomal fusions with indicated yobD-mntP regions grown in LB medium and incubated without and with 400 μM MnCl2 for 1 h. Transcriptional fusions (ii), (iii) and (v) rely on the lacZ ribosome-binding site and translational fusions (i) and (iv) rely on the mntP ribosome-binding site.
(C-D) β-galactosidase activity for strains carrying the PmntP660-lacZ transcriptional (C) and the PLlacO-5′UTRmntP-lacZ translational (D) fusions grown in M9 glucose medium and incubated without or with indicated metals for 1 h.
For all β-galactosidase assays (B-D), the results are given in Miller units as the mean ± SDM of three independent samples.

