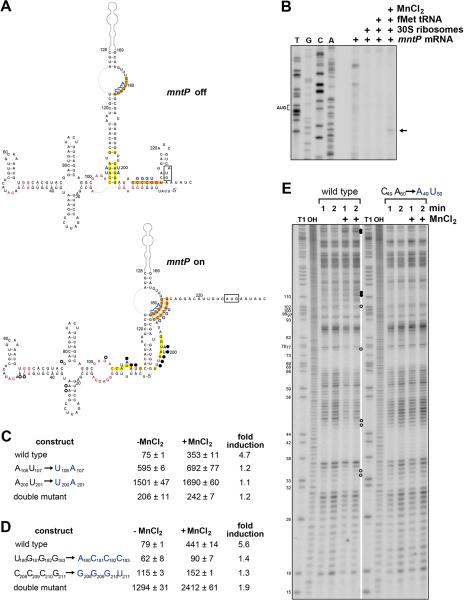
Figure 5. Accessibility of mntP ribosome binding site changes upon manganese binding.
(A) Predicted secondary structure of the complete mntP 5′-UTR from E. coli. The start codon is boxed, nucleotides conserved in >97% of the yybP-ykoY family members are in red (Meyer et al., 2011), regions predicted to base pair in the absence of Mn2+ are highlighted in yellow, while regions predicted to base pair in the presence of Mn2+ are highlighted in orange, and blue letters correspond to mutants assayed in (C-D). Nucleotides whose levels increase in a Mn2+-dependent manner in (E) are indicated with filled circles, nucleotides whose levels decrease are indicated with open circles. See also Figure S4.
(B) Toeprinting assay to examine ribosome binding in the presence and absence of fMettRNA and MnCl2.
(C) β-galactosidase activity for strains carrying PLlacO-5′UTRmntP-lacZ translational fusions with mutations of potential base pairing region highlighted in yellow in (A).
(D) β-galactosidase activity for strains carrying PLlacO-5′UTRmntP-lacZ translational fusions with mutations of potential base pairing region highlighted in orange in (A). For β-galactosidase assays in (C-D), cells grown in M9 glucose medium were incubated with or without 400 μM MnCl2 for 1 h, and the results are given in Miller units as the mean ± SDM of three independent samples.
(E) Lead probing of the mntP 5′-UTR structure. Filled circles indicate bands that increase for wild type but not mutant mntP in the presence of MnCl2, and open circles indicate those bands that decrease. Lanes labeled T1 and OH are the nucleotide size markers derived from the same labeled mntP RNA after incubation with RNase T1 or hydroxyl anions, respectively. Nucleotide positions relative to the transcription start site are labeled to the left of the gel. See also Figure S4.

