
Figure 1.
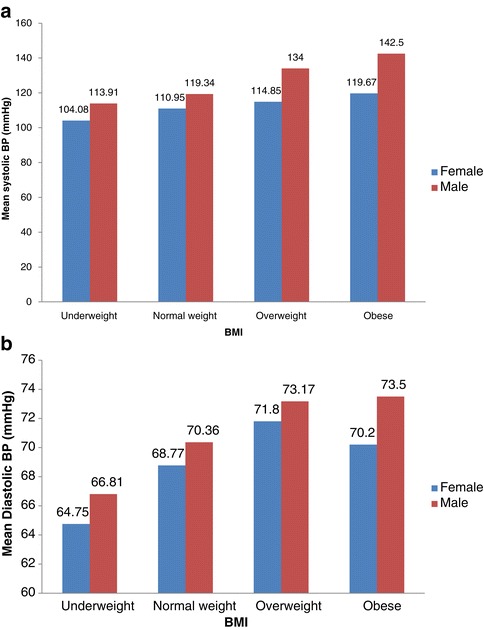
Average Systolic and Diastolic BP and BMI of urban poor youth in Accra. (a) Mean systolic BP by BMI and sex. Pearson correlation = 0.308; P-value = 0.000. (b) Mean diastolic BP by BMI and sex. Pearson correlation = 0.166; P-value = 0.018.
Official websites use .gov
A
.gov website belongs to an official
government organization in the United States.
Secure .gov websites use HTTPS
A lock (
) or https:// means you've safely
connected to the .gov website. Share sensitive
information only on official, secure websites.
Average Systolic and Diastolic BP and BMI of urban poor youth in Accra. (a) Mean systolic BP by BMI and sex. Pearson correlation = 0.308; P-value = 0.000. (b) Mean diastolic BP by BMI and sex. Pearson correlation = 0.166; P-value = 0.018.