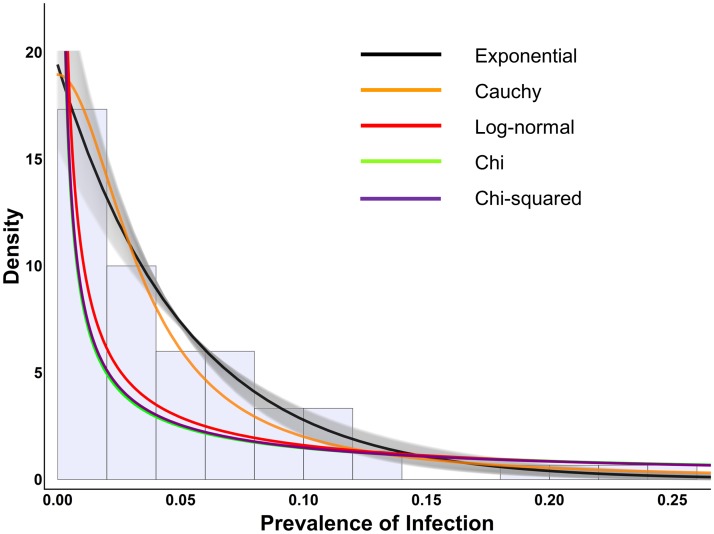
Fig 2. Exponential distribution and other distributions which cannot mimic the exponential, fit to Tanzanian data.
This figure shows the Tanzanian trachoma prevalence data as a histogram in the background along with the fits of various distributions which cannot mimic the exponential. The black line indicates the exponential distribution fit to the data, along with the 95% confidence interval as gray shading. The best fit of all non-exponential distributions fall outside the 95% confidence interval (gray shading) of the exponential and give worse fit to the data.

