
Fig 2. Dose-response curve for GR repression (for eight doses of Dex) is linear-fractional plot.
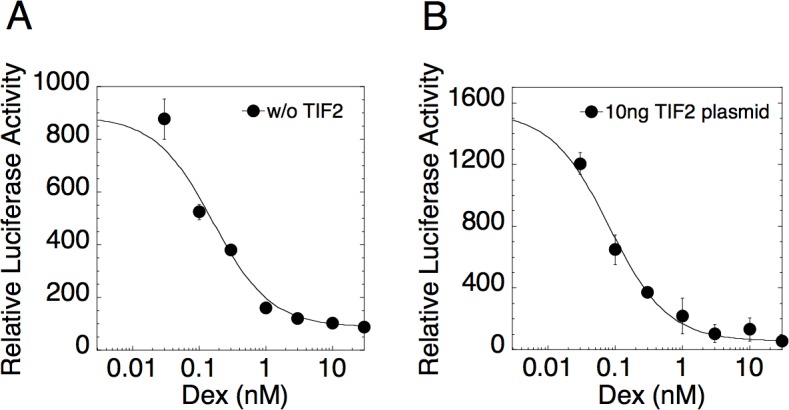
U2OS.rGR cells were transiently transfected with 35ng of AP1LUC plasmid and (A) 0ng or (B) 10ng of TIF2 plasmid and then treated with 15ng/ml of PMA and the indicated concentrations of Dex. Luciferase activity was determined and the data plotted and fit to Equation (1) as described in Materials and Methods (error bars are ± S.D. of triplicates).