
Fig 3. Plots of dose-response parameters for varying concentrations of AP1LUC and TIF2.
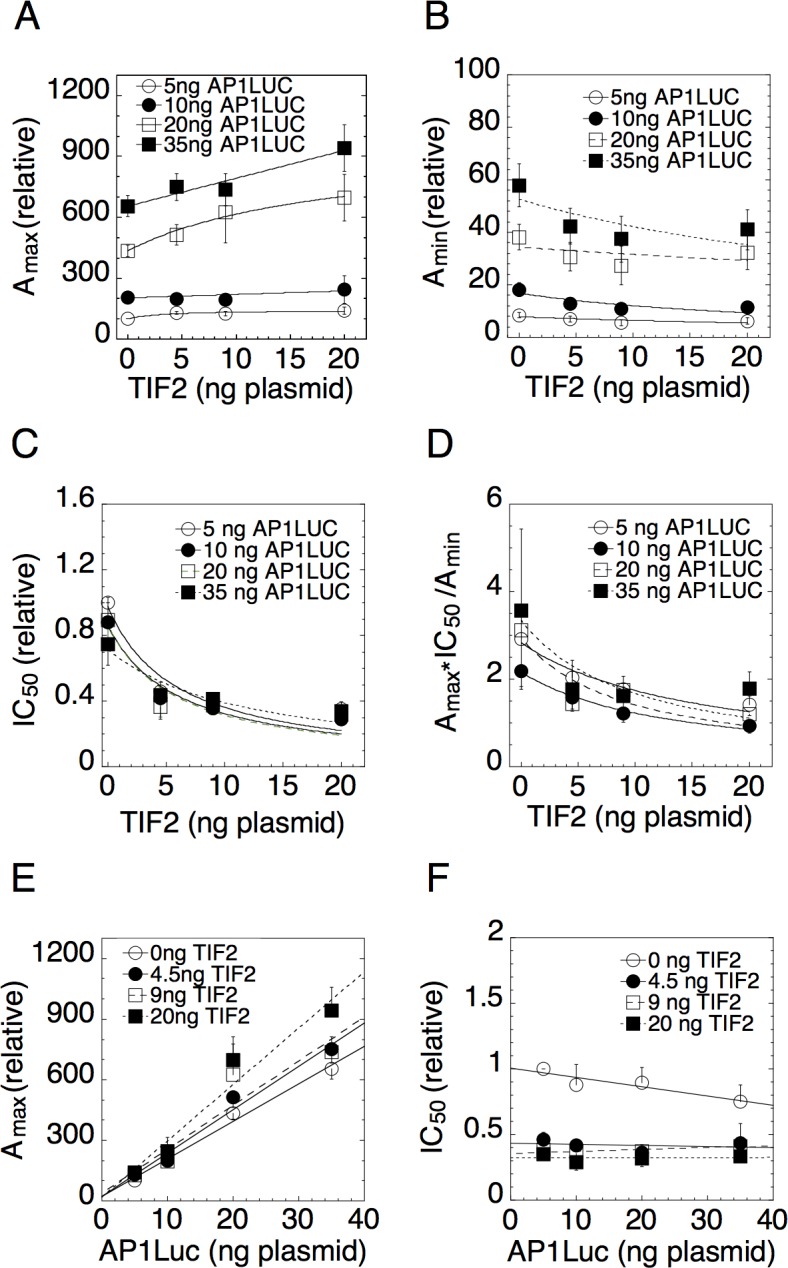
Experiments were conducted with triplicate samples of U2OS.rGR cells that were transiently transfected with the indicated concentrations of AP1LUC and TIF2 plasmids and treated with 25ng/ml of PMA for four concentrations of Dex. Average plots vs. TIF2 for (A) Amax, (B) Amin, (C) IC50, and (D) Amax×IC50/Amin and vs. AP1LUC for (E) Amax and (F) IC50 were obtained by first normalizing the data to the value for the lowest amount of AP1LUC and factor and then averaging and plotting the values (n = 4–12, ± S.E.M.).