
Fig 4. Dose-response parameters for varying concentrations of AP1LUC and NU6027.
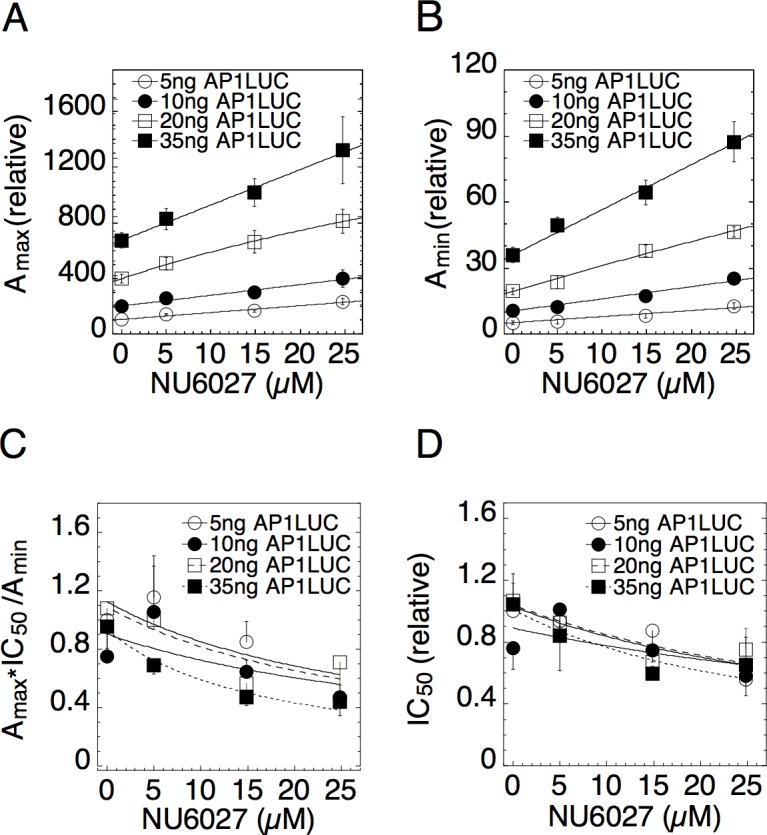
Experimental assays were conducted as in Fig. 3 with 10ng/ml of PMA and four concentrations of Dex. Average plots of (A) Amax, (B) Amin, (C) Amax×IC50/Amin, and (D) IC50 vs. NU6027 were obtained by first normalizing the data to the value for the lowest amount of AP1LUC and factor and then averaging and plotting the values (n = 5, ± S.E.M.).