
Fig. 2.
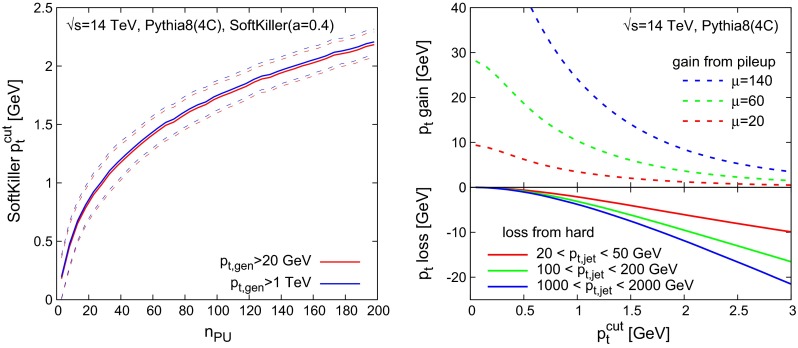
Left Value of the cut applied by the SoftKiller, displayed as a function of the number of pileup events. We show results for two different values of the generator minimal for the hard event, . The solid line is the average value, while the dashed lines indicate the one-standard-deviation band. Right Plot of the that is lost when applying a given cut (the axis) to the constituents of jets clustered (anti-, ) from the hard event (solid lines) and the residual pileup that remains after applying that same cut to the constituents of circular patches of radius in pure-pileup events (dashed lines)