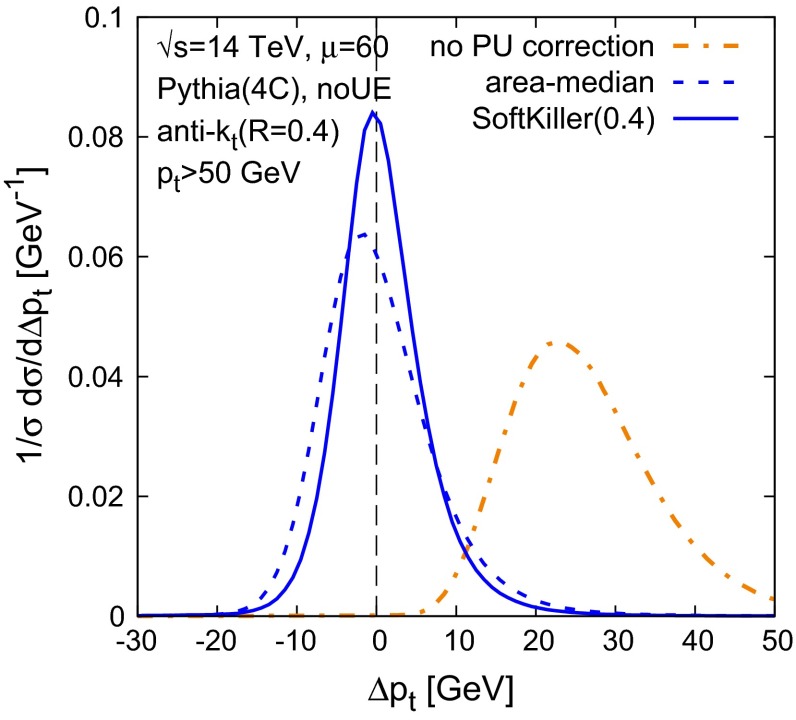
Fig. 4.
Performance of SoftKiller for 50 GeV jets and Poisson-distributed pileup events. We plot the distribution of the shift between the jet after pileup removal and the jet in the hard event alone. Results are compared between the area-median approach and the SoftKiller. For comparison, the (orange) dash-dotted line corresponds to the situation where no pileup corrections are applied

