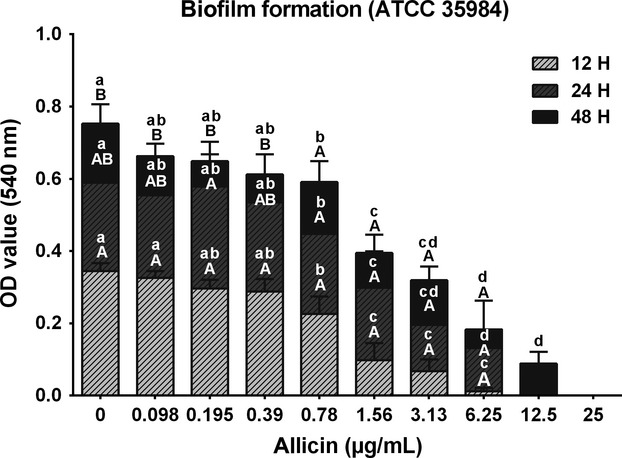
Figure 2.

Staphylococcus epidermidis (ATCC 35984) biofilm formation within 48 h and after exposure to different concentrations (0.098–25 μg/mL) of allicin. Different upper-case letters (A, B) indicate significant (P < 0.001) differences between time points within the same allicin concentration. Different lower-case letters (a–d) indicate significant (P < 0.0001) differences between allicin-treated groups within the same time point.
