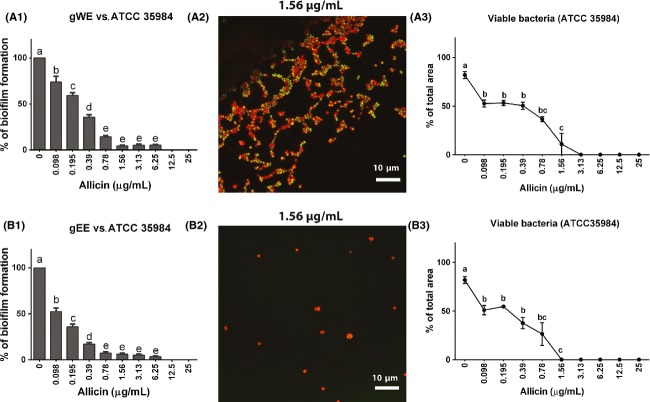
Figure 4.
Comparison of the effect of aqueous (gWE) and ethanol (gEE) extracts of fresh garlic standardized for their allicin concentration on Staphylococcus epidermidis biofilm formation and bacterial viability in the biofilm. The left panel (A1, B1) show the results of the safranin staining methods as mean percentage (±SEM) of biofilm formation. The middle panel (A2, B2) give examples of this viability staining of the two extracts with the same allicin concentration (1.56 μg/mL allicin). The right panel (A3, B3) show the result (mean ± SEM) obtained with quantitative evaluation of bacterial viability determined by differential viability staining with SYTO® green and propidium iodide and confocal microscopy.

