Figure 1.
Expression of genes encoding different Na+ channel isoforms Navx
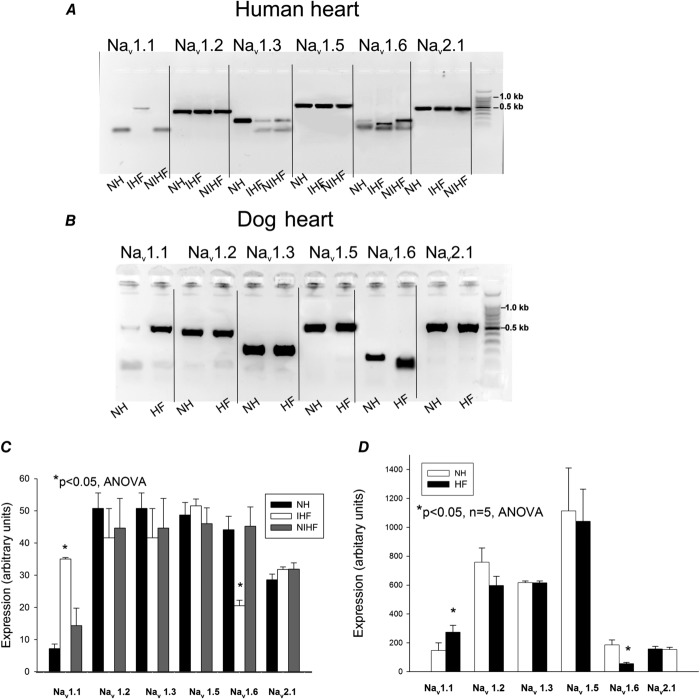
RT-PCR analysis of Nav transcripts in normal and failing human (A) and dog (B) left ventricular tissue samples. A, from left to right: Nav1.1 isoform obtained in normal heart (NH), in explanted heart from patients with ischaemic (IHF), and non-ischaemic (NIHF) heart failure, respectively. The expected 491 bp band was not detected in NH and NIHF, Nav1.2 isoform (417 bp), Nav1.3 isoform (189 bp), Nav1.6 isoform. A specific band of 155 bp is missing in IHF; a non-specific smaller band is present instead. Nav2.1 isoform (586 bp). B, the same Na+ channel isoforms as shown in A were obtained in dog normal (NH) and failing (HF) hearts. Last gel lane on right represents standard bp marker. C, summary data with statistics for Nav isoforms expressed in human heart. RT-PCR gels were analysed in 5–7 tissue samples from left ventricles, D, summary data with statistics for Nav isoforms expressed in dog heart. RT-PCR gels were analysed in 5 samples of ventricular cardiac myocytes from left ventricles of normal dog hearts and failing dog hearts, respectively. *P < 0.05, ANOVA, data are mean ± SEM for both C and D.

