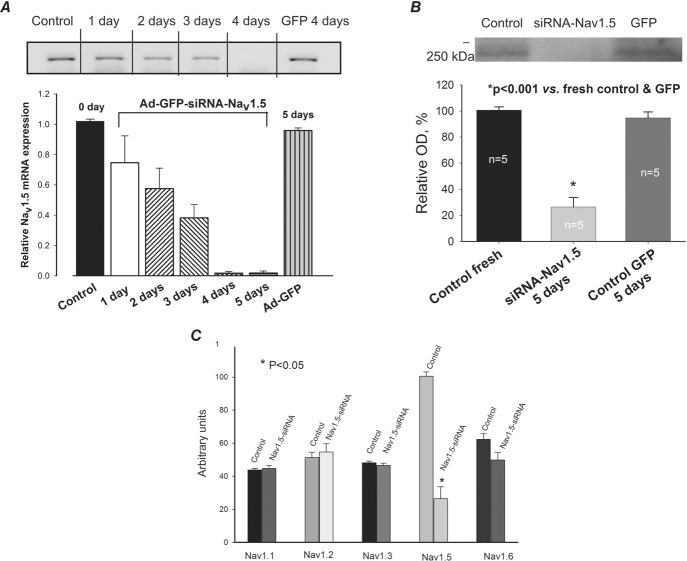
Figure 2.
Silencing of SCN5A gene that encodes Nav1.5 in LV cardiomyocytes of dog with chronic HF by virally delivered siRNA
A, RT-PCR analysis of mRNA abundance in control (fresh isolated cells), in cells infected with virus that contains cDNA for Nav1.5 siRNA + GFP (Ad-GFP-Nav1.5) and GFP alone (Ad-GFP). Upper panel: representative gel of such analysis performed at different times after the virus infection. Lower panel: summary data with statistical analysis of experiments similar to that shown in the upper panel obtained in 5–7 cells. Relative Nav1.5 mRNA is given as relative to control density of bands. *P < 0.05, vs. control and GFP. B, Western blot analysis of Nav1.5 protein abundance in control, and in Ad-GFP-Nav1.5- and Ad-GFP-treated cells. *P < 0.001, vs. control and Ad-GFP. C, RT-PCR analysis of different sodium channel isoforms after transfection with Nav1.5-siRNA (from 4 to 8 samples). *P < 0.05. Statistically significant changes in A, B and C, were evaluated by the ANOVA test followed by Bonferroni's post hoc test. Data are mean ± SEM.

