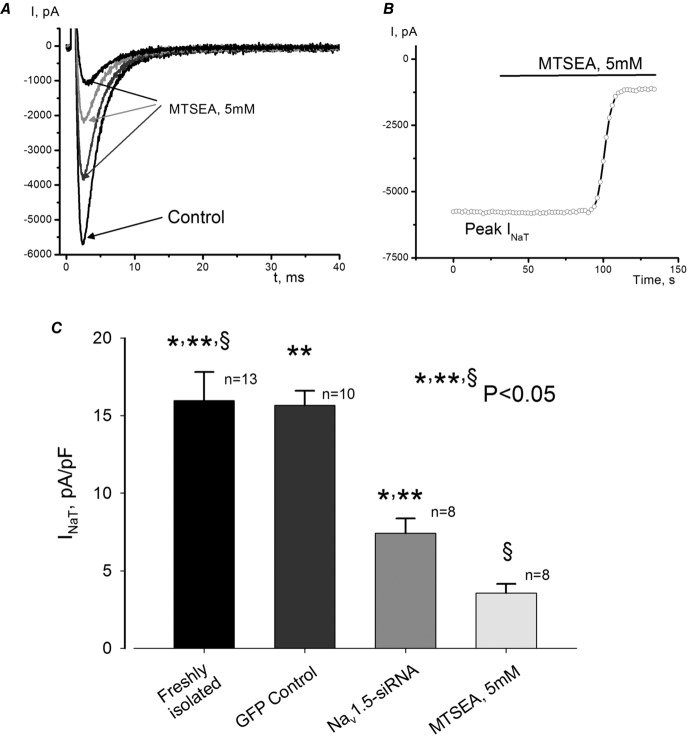
Figure 4.
Contribution of non-cardiac Na+ channel isoforms to INaT in LV cardiomyocytes of dogs with HF
A, consecutive raw INaT traces recorded before (control) and during MTSEA application in freshly isolated cells. B, time course of MTSEA effect on the peak INaT recorded in the same cell as shown in A. C, summary data and statistical analysis of INaT density in freshly isolated control and MTSEA-treated cells and infected cells with virus containing non-silencing siRNA or Nav1.5-siRNA. Statistically significant changes, P < 0.05, were found in both groups evaluated by the ANOVA test followed by Bonferroni's post hoc test (*,** Nav1.5-siRNA vs. freshly isolated control and GFP control, respectively, § MTSEA vs. freshly isolated control) INaT was recorded at –10 mV. Data are mean ± SEM.

