Figure 8.
Contribution of neuronal Nav1.1 to INaL in failing dog ventricular cardiomyocytes
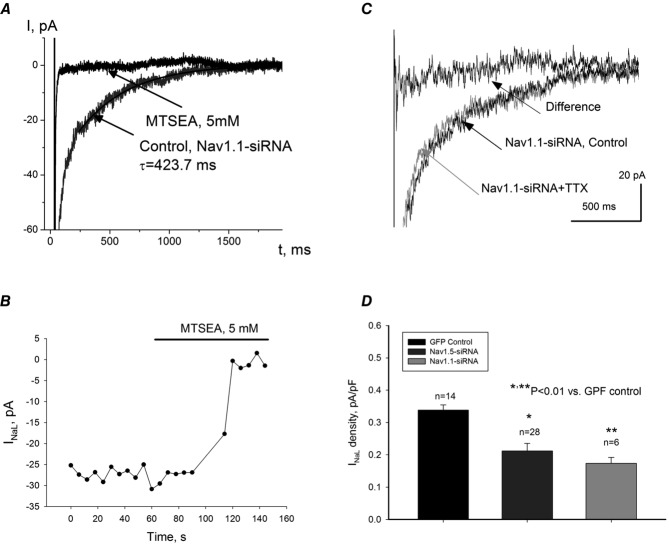
In these cells expression of Nav1.1 was silenced by virally delivered Nav1.1-siRNA. A, raw current traces recorded before (Nav1.1-siRNA, control) and after MTSEA application. Continuous line represents single exponent fit to INaL decay, and value of time constant, τ, is given at the trace. B, time course of INaL amplitude, evaluated between 200 and 220 ms after depolarization onset, during MTSEA application. C, raw current traces recorded before (Nav1.1-siRNA, control) and after 100 nm TTX application (Nav1.1-siRNA + TTX). The difference current was obtained by subtracting currents before and after TTX. D, summary data and statistical analysis of INaL current densities obtained in cells infected with virus that contains cDNA for GFP (GFP Control) for Nav1.5-siRNA + GFP (Nav1.5-siRNA) and for Nav1.1-siRNA + GFP (Nav1.1-siRNA). Current densities were measured 200 ms after depolarization to –10 mV onset. Statistical significance, P < 0.01, between experimental data points presented as mean ± SEM were evaluated by ANOVA followed by Bonferroni's post hoc test.

