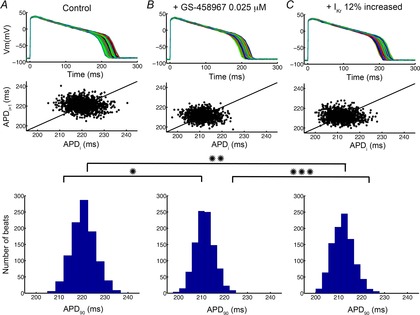
Figure 7.

Predicted sensitivity of APD90 of 1000 action potentials to drug treatment in the presence of a physiological noise current
Graphs show drug-free (A), 0.025 μm GS-458967 (B) or IKr activator (IKr increased by 12%) (C) conditions. Poincaré plots of sequential APD pairs indicating beat-to-beat variability are shown in the middle row for each selected condition. Histogram distributions of APD are shown in the bottom row. *P = 1.9 × 10−297, **P = 1.2 × −255, ***P = 0.0093.
