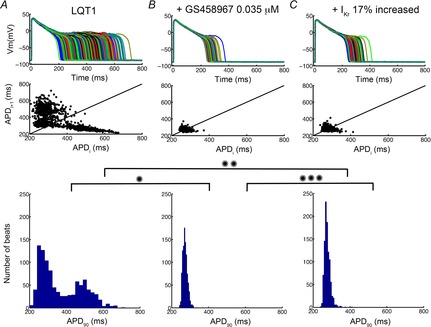
Figure 8.

Predicted sensitivity of 1000 ‘diseased’ LQT1 cell action potentials incorporating physiological noise to induce beat-to-beat variability in response to drug treatment
1000 individual LQT1 model cells are shown. Data in A correspond to baseline LQT1 conditions. B shows the effects of the presence of 0.035 μm GS-458967. C indicates the predicted effects of an IKr activator. Poincaré plots of sequential APD pairs indicating beat-to-beat variability are shown in the middle panel for each case. Histogram distributions of APD are shown in the bottom row. *P = 6.6 × −137, **P = 2.3 × −126, ***P = 9.6 × −10.
