Figure 2.

Synchronization of diastolic Ca release (DCR)
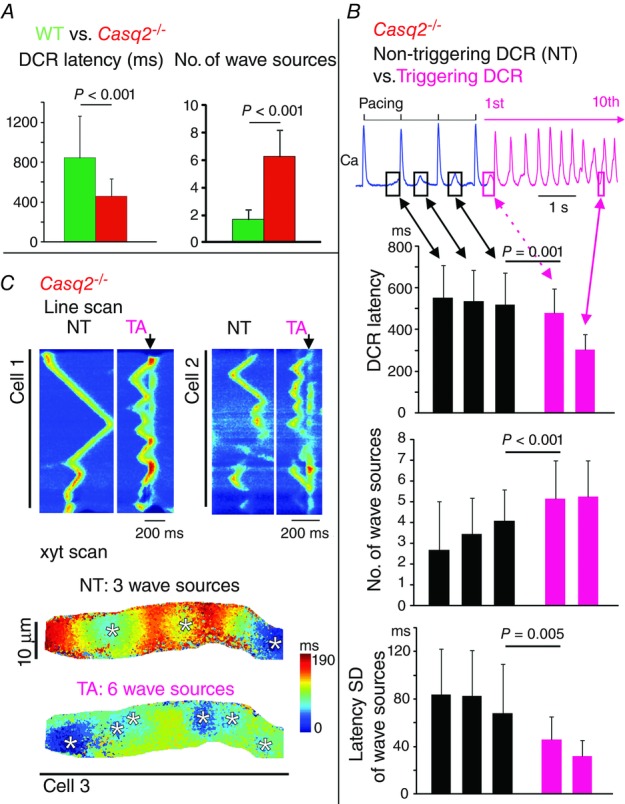
A, latency from the preceding systolic Ca release to the DCR (or DCR latency) and number of wave sources of the first DCR following 2 Hz pacing in WT (n = 10) and Casq2−/− (n = 15) atrial myocytes. B, DCR latency, number of wave sources and synchronization of wave sources (quantified by SD of latency from the preceding systolic Ca release to individual wave sources) in Casq2−/− atrial myocytes (n = 33). These parameters were quantified for the last three DCRs that did not trigger an AP (NT) and for the first and 10th DCRs that triggered an AP (TA). The P values are only shown for comparisons between last NT and first TA. C, representative 1D and 2D scans of DCRs associated with NT and TA in Casq2−/− atrial myocytes. The downward black arrows mark the systolic Ca release, indicative of the presence of an AP. The colours in the 2D map indicate the time of Ca release. The transition from blue to red colour indicates the sequence of Ca wave propagation. The spatial origins of Ca waves (or wave sources) are marked by white asterisks.
