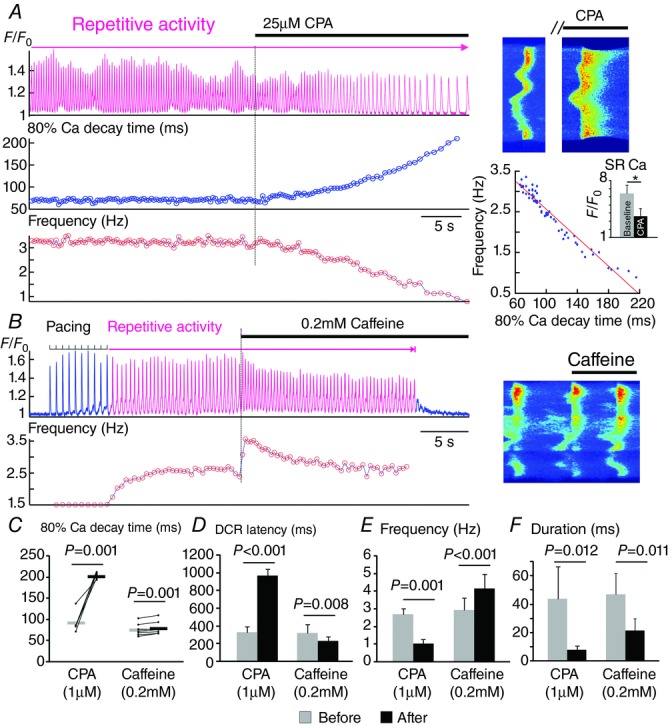
Figure 7.

Regulation of repetitive activity by the rate of Ca re-uptake and functional recovery of RyR2s
A, a representative Ca recording showing the immediate effect of 25 μm cyclopiazonic acid (CPA) in the 80% decay time of a Ca transient and the frequency of repetitive activity. Line scan images from the same recording before and after CPA is shown on the right. Frequency vs. 80% Ca decay time is plotted for each individual beat following the application of CPA. The effect of 1 min treatment with 25 μm CPA on the amplitude of 20 mm caffeine-induced Ca transient (indicative of the SR Ca content) is shown in the bar graph. *P < 0.05. B, a representative Ca recording showing the effect of 0.2 mm caffeine on the frequency of repetitive activity. The line scan image at the moment of caffeine application is shown. C–F, effects of CPA (1 μm, n = 5) and caffeine (0.2 mm, n = 7) on 80% Ca decay time (C), DCR latency (D), frequency (E) and duration (F) of the self-sustained repetitive activity are summarized. To better show the direction of change, paired data points are plotted and connected with thin lines in C. The averages are shown as thick horizontal lines in C.
