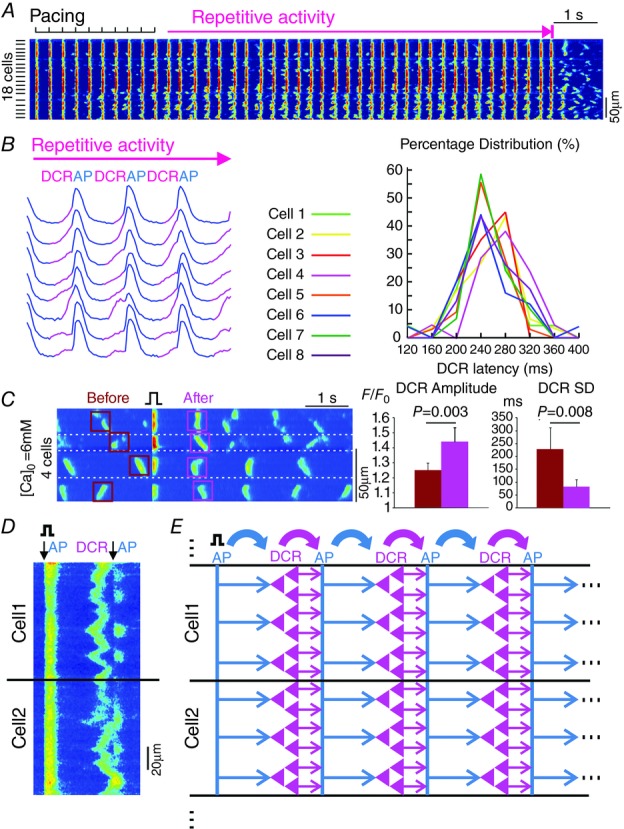
Figure 8.

DCR synchronization in Casq2−/− atrial tissue preparations
A, confocal line scanning from 18 atrial myocytes showing repetitive activity following the cessation of pacing. The scanning line was placed perpendicular to the cell axis. B, Ca transients from eight neighbouring atrial myocytes during repetitive activity. DCRs preceding the systolic Ca release are marked in pink. On the right is the DCR latency distributions of neighbouring atrial myocytes. C, on the left is a representative Ca recording where one pacing stimulus synchronized the previously out-of-phase Ca waves in neighbouring myocytes in atrial tissue. Cell boundaries are marked by white dashed lines. On the right are amplitude and SD of DCRs across atrial myocytes before and after the single stimulus. D, confocal line scanning from two neighbouring atrial myocytes. The scanning line was placed along the cell axis. The downward arrow indicates the systolic Ca release reflecting the occurrence of an action potential (AP). E, schematic illustration of the alternating ‘leapfrog’ interplay between AP and synchronized DCR during self-sustained repetitive activity. That is, AP first synchronizes tissue-wide DCR, which results in an ectopic AP; the AP, in turn, temporally aligns the next DCR. As such, this process repeats itself and maintains the self-sustained repetitive activity.
