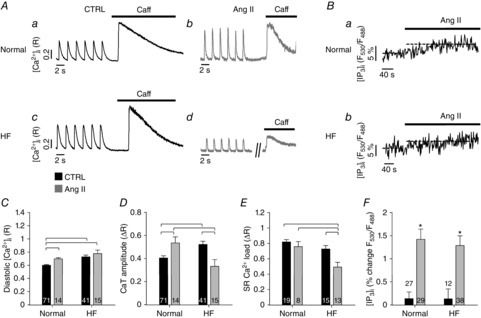
Figure 2.

Effect of Ang II on Ca2+ signalling during ECC in atrial cells
A, electrically and caffeine-evoked CaTs in normal (top) and HF (bottom) atrial cells before (a, c; CTRL) and after (b, d) application of Ang II. B, changes of [IP3]i in normal (a) and HF (b) atrial myocytes revealed by measurement of FRET between CFP and YFP in cells expressing the IP3 biosensor FIRE1-cyt. C, diastolic [Ca2+]i during field stimulation in normal and HF myocytes under control conditions (black) or after treatment with Ang II (grey). D, CaT amplitudes during field stimulation in normal and HF myocytes under control conditions (black) or after treatment with Ang II (grey). E, SR Ca2+ load assessed from changes of [Ca2+]i induced by rapid application of 10 mm caffeine, in normal and HF myocytes under control conditions (black) or after treatment with Ang II (grey). In panels C–E square brackets indicate significant differences at P < 0.05, one-way ANOVA. F, grey bars show average increase of FIRE1-cyt FRET signal (F530/F488) after application of AngII in normal and HF myocytes. Black bars represent changes of control FRET signal over the same time interval in the absence of AngII. *P < 0.05, Student's t test.
