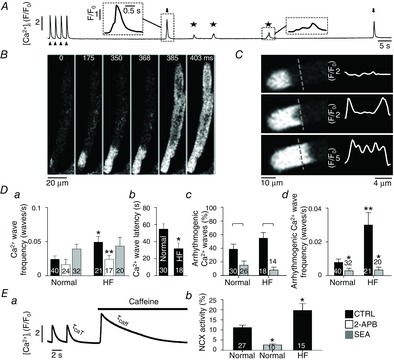
Figure 7.

Arrhythmogenic Ca2+ waves and NCX activity in normal and HF atrial myocytes
A, protocol to monitor spontaneous Ca2+ wave activity. Cells were electrically paced (arrowheads) at 0.5 Hz in 7 mm extracellular [Ca2+] to enhance SR Ca2+ loading. Ca2+ waves were quantified during a 2-min rest period after cessation of pacing. The stars mark spontaneous Ca2+ waves without global cell-wide Ca2+ release and arrows mark arrhythmogenic Ca2+ waves. B, spontaneous Ca2+ wave in a single atrial myocyte observed during a rest period after pacing. The Ca2+ wave led to subsequent global Ca2+ release by triggering an AP and SR Ca2+ release typical for atrial ECC (‘arrhythmogenic Ca2+ wave’). C, confocal 2D image from a central focal plane revealing the ‘U-shaped’ wave front (left) and normalized fluorescence profiles (F/F0) recorded along the dashed line (right). Da, frequency of spontaneous Ca2+ waves in normal and HF cells under control (CTRL) conditions (black), after the application of 2-APB (white) and SEA (grey). *P < 0.05 versus normal control; **P < 0.05 versus HF control, Student's t test. Db, latency of spontaneous Ca2+ waves. *P < 0.05, Student's t test. Dc, fraction of Ca2+ waves that induce a spontaneous AP and global CaTs (‘arrhythmogenic Ca2+ waves’) in HF atrial cells before (black) and after application of SEA (grey). In panel Dc square brackets indicate significant differences at P < 0.05, one-way ANOVA. Dd, absolute frequency of arrhythmogenic Ca2+ waves in normal and HF atrial myocytes in the absence and presence of SEA. To calculate absolute wave frequencies (panels a and d), also cells showing no waves were included. **P < 0.05 versus normal cells in the absence of SEA, Student's t test. *P < 0.05 versus control, Student's t test. Ea, protocol used to determine τCaT and τCaffeine for quantification of NCX activity. Eb, NCX activity in normal atrial cells (left), after inhibition of NCX in normal atrial cells with SEA, and in HF atrial cells. *P < 0.05 against normal cells, Student's t test.
