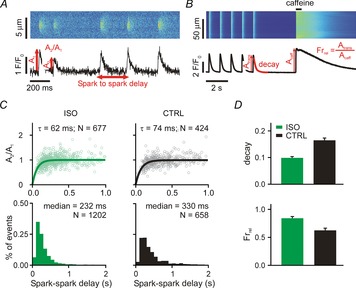
Figure 1.

Ca2+ spark restitution and cellular Ca2+ transients after β-adrenergic stimulation
A, line scan and time courses of repetitive Ca2+ sparks induced by 50 nm ryanodine. Spark-to-spark delay and the amplitude of the second spark relative to the first were calculated and analysed (see annotations). B, line scan and time course of whole cell Ca2+ transient (1 Hz for 25 s) and subsequent caffeine application (10 mm). Ca2+ transient decay and fractional release (Frrel = Atrans/Acaff) were measured for analyses (see annotations). C, each column shows spark amplitude restitution (top; normalized amplitude of the second spark vs. the delay between sparks) and spark-to-spark delay histogram (bottom) for different conditions: (1) ISO, ryanodine plus isoproterenol (100 nm); (2) CTRL, ryanodine only. Bold lines show fits to the data of exponential recovery curves with indicated time constant and number of spark pairs. Histogram binning is 100 ms; N refers to number of spark pairs in each group. D, Ca2+ transient decay and fractional release in (1) ISO (recorded from 25 and 17 cells, respectively) and (2) CTRL (recorded from 20 and 15 cells, respectively) conditions. If not indicated otherwise, P < 0.01.
