
Figure 2.
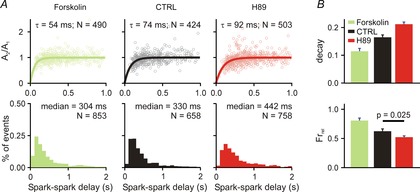
Ca2+ spark restitution and cellular Ca2+ transients after PKA activation/inhibition
A, each column shows spark amplitude restitution (top) and spark-to-spark delay histogram (bottom) for different conditions: (1) forskolin (1 μm), an activator of PKA; (2) CTRL (replotted from Fig.1 for comparison); (3) H89 (1 μm), an inhibitor of PKA. Bold lines show fits to the data of exponential recovery curves with indicated time constant and number of spark pairs. Histogram binning is 100 ms; N refers to number of spark pairs in each group. Spark restitution was performed in presence of 50 nm ryanodine to induce repetitive Ca2+ sparks. B, Ca2+ transient decay and fractional release in (1) forskolin (recorded from 8 cells); (2) CTRL (recorded from 20 and 15 cells, respectively) and (3) H89 (recorded from 23 and 20 cells, respectively) group. If not stated otherwise, P < 0.01.