
Figure 6.
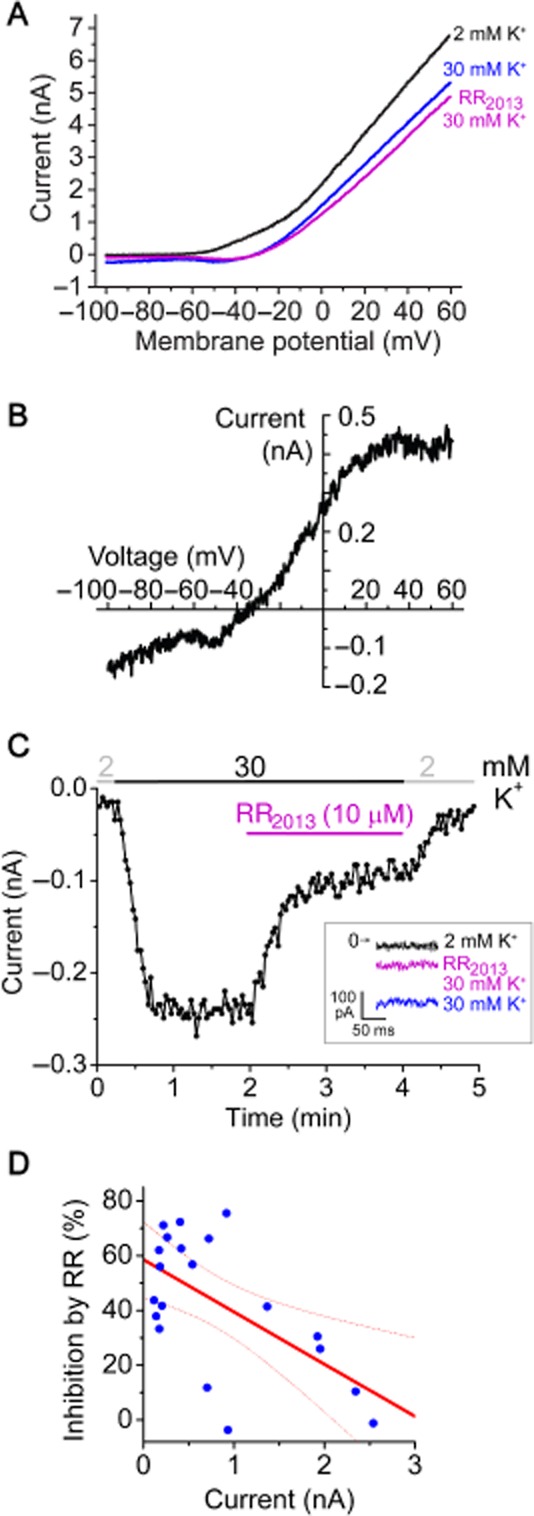
RR-sensitive background potassium current in DRG neurons. (A). Representative current–voltage (I–V) relationships from a mouse DRG neuron. Currents were measured in 2 mM or 30 mM extracellular [K+] in the absence or presence of RR (10 μM) using a voltage protocol consisting of a step to −100 mV for 200 ms from a holding potential of −80 mV, followed by a 600 ms ramp to +60 mV. The I–V relationships were plotted from the ramp data. (B) The difference current inhibited by RR in the presence of 30 mM [K+] is calculated from the data shown in panel A (by subtracting the magenta curve from the blue one). (C) Currents at −100 mV of the same DRG neuron as in panel A were plotted as a function of time. The currents measured during the voltage step to −100 mV are shown in the inset. (D) Correlation between the K+ current amplitude and the RR sensitivity for 20 DRG neurons. The regression line (red solid) and 95% confidence band (red dotted curves) of Pearson's correlation analysis are indicated. All DRG measurements were performed at 37°C.