

Abstract
Background and Purpose
Catechol-O-methyltransferase (COMT) is an important target in the levodopa treatment of Parkinson's disease; however, the inhibitors available have problems, and not all patients benefit from their efficacy. Opicapone was developed to overcome those limitations. In this study, opicapone's pharmacological properties were evaluated as well as its potential cytotoxic effects.
Experimental Approach
The pharmacodynamic effects of opicapone were explored by evaluating rat COMT activity and levodopa pharmacokinetics, in the periphery through microdialysis and in whole brain. The potential cytotoxicity risk of opicapone was explored in human hepatocytes by assessing cellular ATP content and mitochondrial membrane potential.
Key Results
Opicapone inhibited rat peripheral COMT with ED50 values below 1.4 mg⋅kg−1 up to 6 h post-administration. The effect was sustained over the first 8 h and by 24 h COMT had not returned to control values. A single administration of opicapone resulted in increased and sustained plasma levodopa levels with a concomitant reduction in 3-O-methyldopa from 2 h up to 24 h post-administration, while tolcapone produced significant effects only at 2 h post-administration. The effects of opicapone on brain catecholamines after levodopa administration were sustained up to 24 h post-administration. Opicapone was also the least potent compound in decreasing both the mitochondrial membrane potential and the ATP content in human primary hepatocytes after a 24 h incubation period.
Conclusions and Implications
Opicapone has a prolonged inhibitory effect on peripheral COMT, which extends the bioavailability of levodopa, without inducing toxicity. Thus, it exhibits some improved properties compared to the currently available COMT inhibitors.
Tables of Links
| TARGETS |
|---|
| Catechol-O-methyltransferase (COMT) |
| LIGANDS | ||
|---|---|---|
| Adrenaline | Levodopa | Perchloric acid |
| Benserazide hydrochloride | Metanephrine | S-adenosylmethionine |
| Entacapone | Pargyline | Tolcapone |
These Tables list key protein targets and ligands in this article which are hyperlinked to corresponding entries in http://www.guidetopharmacology.org, the common portal for data from the IUPHAR/BPS Guide to PHARMACOLOGY (Pawson et al., 2014) and are permanently archived in the Concise Guide to PHARMACOLOGY 2013/14 (Alexander et al., 2013).
Introduction
The most efficacious treatment for Parkinson's disease (PD), the second most prevalent neurodegenerative disease in the world affecting 1% of the population above 65 years of age, is still the replenishment of dopamine shortage by giving patients L-3,4-dihydroxyphenylalanine (levodopa), the natural precursor of dopamine (Olanow and Schapira, 2013). Nevertheless, the progression of the disease requires gradual increases in levodopa dosage for adequate motor control, leading to the development of motor complications such as motor fluctuations and dyskinesia. These side effects are suggested to result from the plasma levodopa fluctuations associated with oral levodopa treatment that result in intermittent striatal dopamine levels (Olanow and Schapira, 2013). The ideal treatment should deliver continuous and sustained dopamine levels matching the physiological ones (Rodriguez-Oroz et al., 2011). Orally administered levodopa is subject to extensive peripheral metabolism by aromatic amino acid decarboxylase and catechol-O-methyltransferase (COMT) being, thus, given in combination with inhibitors of these enzymes.
COMT (EC 2.1.1.6; nomenclature follows Alexander et al., 2013), catalyses the O-methylation of catechol-containing substrates by transferring, in the presence of magnesium, a methyl group from S-adenosylmethionine and thus playing a critical role in the metabolism of biologically active or toxic catechols, such as catecholamines, their hydroxylated metabolites, catechol estrogens and exogenous catechols (Guldberg and Marsden, 1975). COMT is a ubiquitous enzyme present in all mammalian tissues with the highest activities being described in liver, kidney and gastrointestinal tract (Karhunen et al., 1994). Erythrocytes also contain COMT and are the most convenient source of enzyme for clinical studies. COMT inhibitors currently approved for clinical use are entacapone, a peripherally acting compound, and tolcapone, a compound that crosses the blood–brain barrier, but has clinically restricted usage because of potential hepatotoxic effects (Keating and Lyseng-Williamson, 2005). Entacapone, although never associated with safety issues (Brooks, 2004), has low to moderate oral bioavailability with a wide inter-individual variation and elevated withdrawal rates (Lees, 2008). These pharmacodynamic, pharmacokinetic, clinical efficacy or safety problems (Kaakkola, 2010), limit the benefits PD patients can take from the therapy. There is an unmet need for more efficacious and safe COMT inhibitors (Kaakkola, 2010). 2,5-Dichloro-3-(5-(3,4-dihydroxy-5-nitrophenyl)-1,2,4-oxadiazol-3-yl)-4,6-dimethylpyridine 1-oxide (opicapone) is a COMT inhibitor that is a hydrophilic 1,2,4-oxadiazole analogue with a pyridine N-oxide residue at position 3 giving high inhibitory potency while avoiding cell toxicity (Kiss et al., 2010) that is currently in phase III clinical trials by BIAL – Portela and Ca, S.A. (S. Mamede do Coronado, Portugal) for use as adjunctive therapy in levodopa-treated PD patients (Ferreira et al., 2012).
The present study was aimed at characterizing the pharmacological properties of opicapone after oral administration to rats and evaluates the potential cytotoxic effect of this compound in human cryopreserved hepatocytes, using as comparators entacapone, not associated with cytotoxicity, and tolcapone, associated with cytotoxicity. Opicapone was found to have a strong and prolonged inhibitory effect on peripheral COMT, not interacting with the brain enzyme. Upon oral administration of levodopa/benserazide opicapone led to a prolonged and sustained increase in the peripheral and central bioavailability of levodopa with a concomitant reduction in 3-O-methyldopa (3-OMD) levels. Regarding its potential cytotoxicity, opicapone was shown to be the compound with the lowest cytotoxic potential.
Methods
Cell culture
Human cryopreserved plateable hepatocytes (batches HC3-15+ and HB35+,) and the hepatocyte isolation kit K2000 were acquired from XenoTech (Lenexa, KS, USA). Cryopreserved plateable hepatocytes (both lots) were thawed and prepared as a pool, according to the manufacturer's instructions. Cells were seeded at a density of 30 000 viable cells per well in collagen-coated 96-well black/clear culture plates and incubated for 24 h at 37°C in humidified 5% CO2-95% air in DMEM high glucose supplemented with 2 mM glutamine, 1% ITS Liquid Media Supplement (10 mg⋅L−1 insulin, 5.5 mg⋅L−1 transferrin, 5 μg⋅L−1 selenium), 10% FBS, 100 U⋅mL−1 penicillin G, 100 μg⋅mL−1 streptomycin and 25 mM N-2-hydroxyethylpiperazine-N′-2-ethanosulphonic acid.
Animal welfare and ethical statement
All animal procedures were conducted in strict adherence to the 2010/63/EU European Directive on the protection of animals used for scientific purposes, the Portuguese law on animal welfare (Decreto-Lei 113/2013) and the Guide for the Care and Use of Laboratory Animals (eight edition, 2011). All procedures were as humane as possible, and the number of animals used was the minimum possible in compliance with current regulations and scientific integrity. All studies involving animals are reported in accordance with the ARRIVE guidelines for reporting experiments involving animals (Kilkenny et al., 2010; McGrath et al., 2010).
Animal treatments
Male Wistar rats (240) obtained from Harlan (Barcelona, Spain) were used. Rats were kept eight per cage, under controlled environmental conditions (12 h light/dark cycle and room temperature 22 ± 1°C) with food and tap water allowed ad libitum. Food was removed from animals 6–15 h before the administration of any drugs and the experiments were all carried out during daylight hours. Twenty minutes before being killed, the animals were anaesthetized with sodium pentobarbital (60 mg⋅kg−1, i.p.). After sample collection, anaesthetized animals were killed by decapitation. Opicapone and tolcapone were administered via the oral route (4 mL⋅kg−1 in 0.5% carboxymethylcellulose) using animal feeding stainless steel curved needles. Levodopa and benserazide were administered p.o. in 0.9% sodium chloride.
In experiments designed to evaluate the efficacy of the compound at inhibiting COMT, animals were administered opicapone (0.03, 0.1, 0.3, 0.6, 1, 3 and 10 mg⋅kg−1) and were killed at 2 and 6 h post-administration. In experiments designed to evaluate COMT time-activity profile, animals were given opicapone (3 mg⋅kg−1) and were killed at different post-administration periods (15 and 30 min, and 1, 2, 4, 8, 18, 24, and 48 h). In experiments designed to evaluate the effects of the compounds on central catecholamines, animals were given 3 mg⋅kg−1 opicapone or tolcapone and 1 h before being killed, animals were administered levodopa/benserazide (levodopa 12 mg⋅kg−1 and benserazide 3 mg⋅kg−1).
Tissue collection and processing
Blood was collected from anaesthetized animals by cardiac puncture using heparin-containing syringes after which animals were perfused by the same route with 10 mL 0.9% sodium chloride. Fragments of liver, left kidney and whole brain without the cerebellum were removed and put in plastic vials, containing 5 mM sodium phosphate buffer pH 7.8, for evaluating enzyme activity. For the analysis of catecholamines half the brain without the cerebellum was quickly removed, put in pre-weighed tubes containing 2 mL 0.2 M perchloric acid (PCA) and was stored at −80°C.
Blood was centrifuged at 1500× g for 10 min (4°C). The upper cell layer was discarded and erythrocytes were added to one volume of cold 0.9% NaCl. After the sample had been mixed gently, erythrocytes were centrifuged at 1500× g for 10 min (4°C). Erythrocytes were washed twice under the same conditions and were stored frozen at −80°C. Plasma was collected and stored at −80°C for subsequent quantification of opicapone.
Microdialysis
Rats were anaesthetized with pentobarbital (60 mg⋅kg−1 i.p.) and this state was maintained throughout the surgery for microdialysis probe implantation. Depth of anaesthesia was verified by loss of blink reflex and by loss of response to reflex stimulation (toe pinch with firm pressure). Body temperature was kept stable with a heating pad. A CMA/20 probe (4 mm polycarbonate membrane length, 20 KD molecular cut-off; CMA Microdialysis AB, Kista, Sweden) was inserted into the right jugular vein. An incision was made in the skin to expose the right jugular vein and an introducer (corresponding to a needle inserted into tubing) was inserted into the right jugular vein. By removing the needle, the microdialysis CMA/20 probe was inserted through the tubing. The probe was then secured by suture on the pectoral muscle, and the tubing was removed. The inlet and the outlet of probe were passed s.c. to exit at the back of neck. Local anaesthetic was applied in the areas of incision. After placement of the microdialysis probe, the rats were transferred to the CMA 120 System for Freely Moving Animals (CMA Microdialysis AB) and were allowed 24 h for recovery with free access to food and water. Animals were awake and freely moving during the experimental phases and had access to food pellets only in the afternoons after sample collection. During the experimental procedures, the probe was perfused continuously with Ringer solution at a flow rate of 2 μL⋅min−1.
Dialysate samples were collected automatically with a refrigerated fraction collector (CMA/170; CMA Microdialysis AB) every 20 min, which corresponds to a volume of 40 μL each, and acidified with 10% v v−1 PCA 2 M. All dialysate samples were subsequently stored at −70°C until required for analysis. On each experimental day, the first eight samples before the administration of levodopa/benserazide were used to define the basal level of the analytes. In vivo microdialysis probe recovery values were 24 ± 6% for levodopa and 27 ± 5% for 3-OMD (mean ± SD) and were found to be comparable with the recoveries in vitro. The ratio in vivo/in vitro in all tested probes was approximately 1. The in vivo and in vitro behaviour of the MD probes was similar under the same conditions of flow and perfusion, along the same range of concentrations of levodopa and 3-OMD. The integrity of the probes throughout the experimental protocol was guaranteed by evaluating the percentage of difference between the recovery values of the probes before and after the animal experimental procedure. The recovery of the probes before in vivo sampling was not significantly different (P < 0.05) from the recovery of these probes 3 experimental days after insertion in the animals.
Catecholamine assay
Concentrations of catecholamines in dialysates and brain were determined by reverse-phase HPLC (RP-HPLC) with electrochemical detection as described previously (Bonifácio et al., 2014). Dialysates were allowed to thaw on ice and 50 μL were injected without processing on HPLC-ED. Regarding brains, tissues were thawed, left at 4°C for 4–6 h and then 500 μL of the 0.2 M PCA where tissues were immersed were removed and filtered through 0.2 μm Spin-X filters (Corning Life Sciences, Amsterdam, The Netherlands). A 50 μL sample was injected on HPLC-ED.
COMT activity
On the day of the experiment, erythrocytes were thawed in ice and haemolysed by the addition of four volumes of MilliQ water. After vigorous mixing, the tubes were kept on ice for 10 min, after which they were centrifuged at 20 000× g at 4°C for 20 min. The supernatant collected was used for the COMT activity assay. Tissues were thawed on ice. Liver fragments were homogenized in a Precellys 24 Dual Tissue Homogenizer (Bertin Corporation, Washington DC, USA) for two cycles of 5 s with an interval of 5 min on ice. Kidney and brains were homogenized with Silent Crusher M homogenizer (Heidolph, Schwabach, Germany) with probe 8F/M for about 45 s at maximum velocity. Homogenates were used for COMT activity determination. Total protein in homogenates and haemolysed samples was determined with the BioRad Protein Assay (BioRad, Hercules, CA, USA) using a standard curve of BSA (50–250 μg⋅mL−1).
COMT activity was determined using adrenaline as a substrate and measuring the metanephrine formed as described previously (Bonifácio et al., 2003). In brief, the reaction mix (total volume of 1000 μL) contained 500 μL sample (2 mg total protein), pargyline (100 μM), magnesium chloride (100 μM), EGTA (1 mM), S-adenosylmethionine (500 μM for liver and erythrocytes; 250 μM for kidney and 100 μM for brain) and adrenaline (1000 μM for liver, erythrocytes, kidney and 100 μM for brain) in 5 mM phosphate buffer pH 7.8. Reactions were started with the substrate and were then carried out for 5 min (liver), 10 min (erythrocytes and kidney) or 15 min (brain) at 37°C. Reactions were stopped by the addition of 200 μL 2 M PCA and, after deproteinization, samples were injected onto HPLC-ED.
ATP assay
ATP content of human primary hepatocytes was determined using the ATP Lite assay system (Perkin Elmer, Waltham, MA, USA), which is based on the production of light caused by the reaction of ATP with added luciferase and D-luciferin. Twenty-four hours after being seeded, cell cultures were washed with Hank's balanced salt solution (HBSS) and were then incubated with test compounds prepared in culture media without fetal bovine serum (0, 1.56, 3.13, 6.25, 12.5, 25, 50, 100 and 200 μM) for 24 h at 37°C in humidified 5% CO2-95% air. Positive controls (cells incubated with carbonyl cyanide-p-trifluoromethoxyphenylhydrazone – FCCP, 10 and 50 μM) were run in parallel. After incubation, media were removed from the wells and substituted with 100 μL HBSS plus 50 μL cell lysis solution. Plates were shaken for 5 min at 400 r.p.m. at room temperature. Substrate solution (50 μL) was then added to each well and plates were again shook for 5 min at 400 r.p.m. at room temperature in subdued light. Three standard concentrations of ATP (1, 10 and 100 μM) and blanks were run in parallel in plate wells without cells. Plates were dark adapted for 10 min and luminescence was determined on a MicrobetaTriLux (Perkin Elmer) scintillation counter.
Mitochondrial membrane potential assay
Mitochondrial membrane potential evaluation in human primary hepatocytes was performed using the fluorescent dye JC-1. JC-1 selectively enters into the mitochondria and, while in healthy cells with high mitochondrial membrane potential, JC-1 spontaneously forms complexes with intense red fluorescence, in apoptotic or unhealthy cells with low membrane potential, JC-1 remains in the monomeric form showing green fluorescence. Twenty-four hours after being seeded, cell cultures were washed with HBSS and 100 μL 15 μM JC-1 prepared in HBSS were added. After 1 h incubation at 37°C in the dark, the solution was removed from the wells and cells were washed once with 100 μL HBSS. Cells were then incubated with test compounds prepared in culture media without FBS (1.56, 3.13, 6.25, 12.5, 25, 50, 100 and 200 μM) for 24 h at 37°C in humidified 5% CO2-95% air. Negative controls (no compound) and positive controls (cells incubated with FCCP, 10 and 50 μM) were run in parallel. After the incubation, media were removed from the cells and substituted with 100 μL HBSS. Fluorescence was measured using a fluorescence microplate reader (Spectramax Gemini, Molecular Devices, Sunnyvale, CA, USA) at λex485 nm, λem538 nm (green) and λex544 nm, λem590 nm (red). Mitochondrial membrane potential was calculated as: ratio = λex544λem590/λex485λem538.
Plasma concentration time profile of opicapone
Following precipitation with acetonitrile 0.1% formic acid the extracted samples were analysed using LC-MS (Agilent, AP-ESI, 1100 Series, Agilent Technologies, Santa Clara, CA, USA) with negative ion detection. The separation of opicapone was performed on a on Zorbax Sb C18, 3.5 μm, 4.6 × 150 mm (Agilent Technologies) using water: acetonitrile 0.1% formic acid as the mobile phase. Selected ion monitoring with the detection of m/z 412 was used. For maximal sensitivity, the fragment energy was set to 100 V and further settings were 3500 eV for the capillary voltage, 350°C nebulizer gas temperature and 40 psi nebulizer pressure.
Data analysis
Data analysis was performed using Prism 5 or Prism 6 for Windows software (GraphPad Software, Inc., San Diego, CA, USA). For graphical representations and for the calculation of pharmacokinetic parameters, baselines values (calculated as the mean of samples collected between t = −150 and t = −10 min) were subtracted and negative values considered zero. The areas under the plasma concentration–time curves (AUC) were calculated using Prism 5. The following variables for levodopa and 3-OMD were also derived from the individual plasma concentration–time curve: maximum concentration observed (Cmax) and the time of occurrence of Cmax (tmax). ED50 values were determined by fitting the experimental data to the log (inhibitor) versus normalized response–variable slope equation. Inhibitory effects of test compounds both on membrane potential and ATP content were expressed as IC50 values, determined by fitting experimental data to the log (inhibitor) versus normalized response–variable slope equation:  .
.
Pharmacodynamics modelling
The time-course of COMT inhibition in the erythrocytes was described using a simple empirical model, Ea = f(t), expressed in Eqn. 2013.
| 1 |
This equation describes the % enzyme activity (Ea) as a function of time (t) and is composed of two distinct parts. The first term expresses the onset of enzyme inhibition, where parameters D and L relate to the extent of COMT inhibition (Emax) and to Tmax respectively. The second part of the equation describes the recovery of enzyme activity as an exponential function, with constant k. The curve parameters D, L and k were adjusted to the experimental data points by non-linear least-squares, using software Prism 6.
Statistical methods
Comparisons of AUC and Cmax between treatment periods were performed using one-way anova followed by Dunnett's post hoc test. Comparison of tmax between treatment periods was performed with Kruskal–Wallis test. Comparisons between catecholamine levels in rat brains were performed by one-way anova followed by Tukey's post hoc test. P < 0.05 was considered significant.
Drugs and reagents
Opicapone and tolcapone were manufactured by BIAL-Portela & Cª, S.A. (S. Mamede Coronado, Portugal). Levodopa, benserazide hydrochloride, catecholamine standards, 5,5′,6,6′-tetrachloro-1,1′,3,3′-tetraethyl-imidacarbocyanine iodide (JC-1) and all cell culture media and reagents were obtained from Sigma-Aldrich (St. Louis, MO, USA). FBS was obtained from Gibco (Life Technologies, Madrid, Spain).
Results
Opicapone and COMT activity
Opicapone, when given p.o. to rats, led to strong inhibition (>80% inhibition) COMT activity from liver and kidney from 1 to 8 h post-administration, with the enzyme slowly recovering activity and reaching 70–86% of control values at 48 h (Figure 1).
Figure 1.
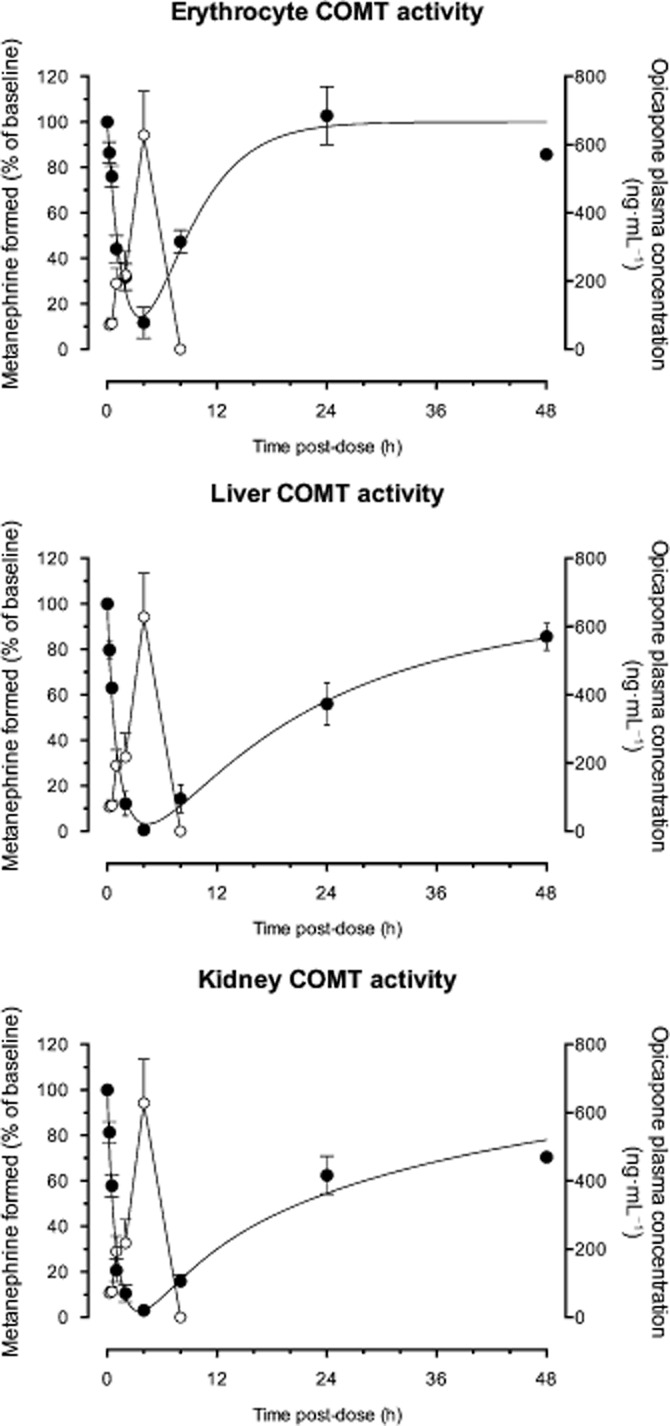
Non-linear regression fittings of erythrocyte, liver and kidney COMT activity (% of baseline, closed symbols) and exposure to opicapone (open symbols) versus time after 3 mg⋅kg−1 opicapone. Data represent means ± SEM for an n of 4–10 rats. Curves represent enzyme inhibition modelled using Eqn. 2013, by adjusting the model parameters to the experimental data with non-linear least-squares fitting using Prism 6 software.
The erythrocyte inhibitory profile obtained was similar to that of liver and kidney; however, the inhibition level attained in all time points was slightly lower than in liver and kidney. Plasma levels of opicapone reached a tmax at 4 h following administration, with a Cmax of 661.5 ± 239.8 ng⋅mL−1 and an AUC0−t value of 2409.6 ± 823.4 h·ng⋅mL−1. At 8 h post-administration no opicapone was detected in the circulation.
The % enzyme inhibition time-course was modelled using Eqn. 2013. The fitted parameters D and L were found to be tissue-dependent, thus reflecting different exposures and pharmacokinetics of the drug. The exponential term in Eqn. 2013 describes the decay of enzyme inhibition (activity recovery). The kinetic recovery constant, k, was found to be higher in the erythrocytes, k = 0.199 ± 0.023 h−1 (average ± SD), corresponding to an inhibition half-life of 3.5 ± 0.4 h. The enzyme inhibition in the liver and kidney, on the other hand, presented lower, but similar kinetic recovery constants of k = 0.053 ± 0.004 h−1 and k = 0.045 ± 0.010 h−1 respectively. The inhibition half-lives were found to be 13.0 ± 1.1 h and 15.3 ± 3.2 h, respectively, in the two tissues.
The potency of opicapone in inhibiting COMT in vitro ex vivo was evaluated by dosing rats with increasing amounts of opicapone and measuring enzyme activity in erythrocytes, liver, and kidney at 2 and 6 h post-administration. The dose-dependent curves obtained are represented in Figure 2 and the correspondent derived ED50 values are shown in Table 1.
Figure 2.
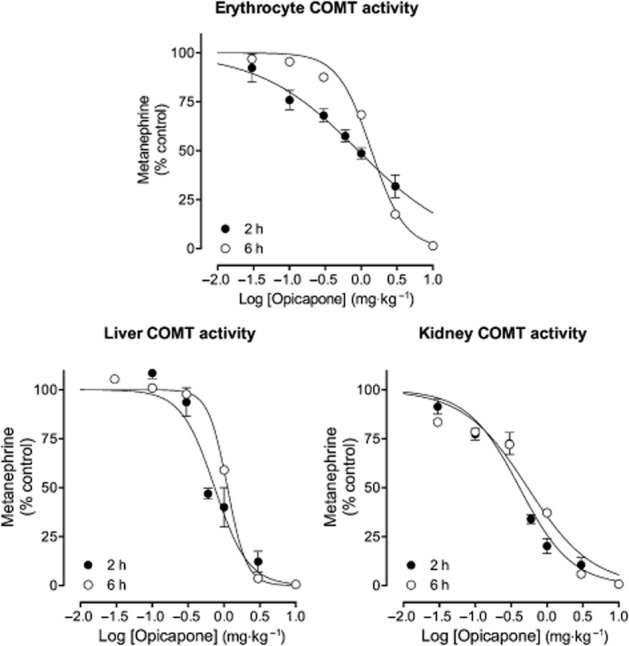
Dose–response curves for effect of opicapone on the activity of COMT. Wistar rats were given 0.03, 0.1, 0.3, 0.6, 1.0 and 3.0 mg⋅kg−1 opicapone and COMT activity was evaluated in liver, kidney and erythrocytes at 2 and 6 h post-administration. Data represent mean ± SEM of an n of 4–10 rats.
Table 1.
ED50 values of opicapone for COMT activity
| ED50 (mg⋅kg−1) | ||
|---|---|---|
| Organ | 2 h | 6 h |
| Erythrocytes | 0.9 (0.7; 1.3) | 1.4 (1.2; 1.7) |
| Liver | 0.7 (0.6; 1.0) | 1.1 (1.0; 1.3) |
| Kidney | 0.4 (0.3; 0.5) | 0.5 (0.4; 0.8) |
ED50 values are presented with 95% CIs in parenthesis.
Opicapone was equipotent at inhibiting the enzyme in the various peripheral organs with ED50 values varying between 0.4 and 0.9 mg⋅kg−1 at 2 h post-administration and between 0.5 and 1.4 mg⋅kg−1 at 6 h post-administration. Brain COMT was also evaluated at 6 h post-administration, but opicapone failed to inhibit the central enzyme (data not shown).
Opicapone and systemic levodopa pharmacokinetics
The effect of opicapone on the pharmacokinetics of systemic levodopa was investigated by measuring the levels of levodopa and 3-OMD in the bloodstream, through microdialysis in the right jugular vein of rats administered 12 mg⋅kg−1 levodopa and 3 mg⋅kg−1 benserazide p.o. on 3 consecutive days. The time–concentration profiles obtained for levodopa and 3-OMD in the 3 treatment days are shown in Figure 3 and the pharmacokinetic parameters derived are presented in Table 2.
Figure 3.
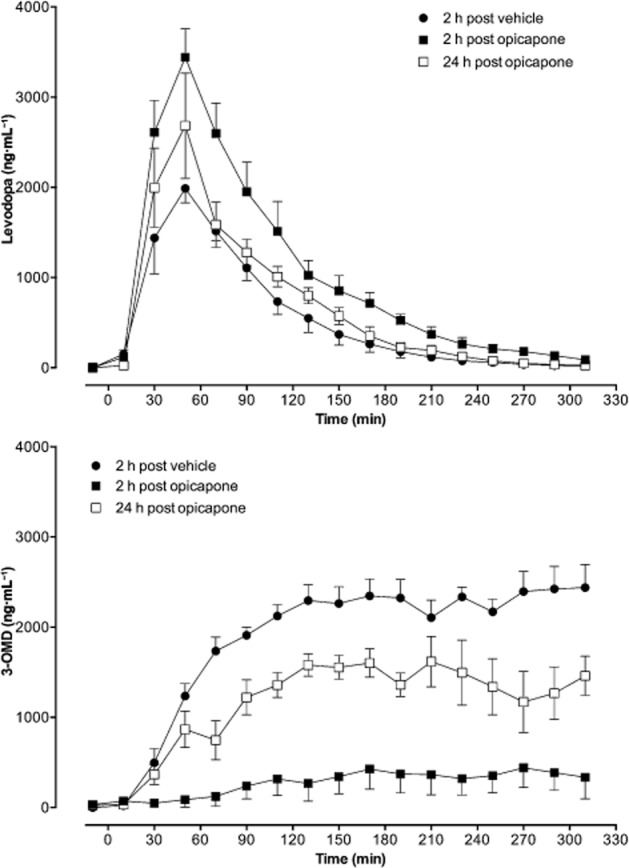
Levels of levodopa and 3-OMD in the bloodstream evaluated by means of microdialysis in the right jugular vein of rats administered 12 mg⋅kg−1 levodopa and 3 mg⋅kg−1 benserazide, p.o., on 3 consecutive days. On day 1 (vehicle), rats received vehicle 2 h before levodopa/benserazide. On day 2 (opicapone), rats received opicapone 2 h prior levodopa/benserazide. On day 3 (24 h post opicapone), rats that were treated with opicapone 24 h earlier, received vehicle 2 h before levodopa/benserazide. Dialysate samples were collected over 20 min periods starting at −150 min before levodopa/benserazide dosing until 310 min post-dose. Values are presented as mean ± SEM (n = 5–6) and were subtracted from their corresponding baseline values, calculated as the means of the samples collected before each levodopa/benserazide administration (from −150 to −10 min), to minimize inter day variability.
Table 2.
Pharmacokinetic parameters (Cmax, tmax and AUC) of systemic levodopa and 3-OMD following oral administration of levodopa/benserazide (12/3 mg⋅kg−1) after vehicle or 2 h or 24 h after 3 mg⋅kg−1 opicapone
| Treatment period | Cmax (ng⋅mL−1) | tmax (min) | AUC (ng⋅min⋅mL−1) |
|---|---|---|---|
| Levodopa | |||
| 2 h post vehicle | 2196 (18.9) | 50 (30–90) | 172 147 (28.4) |
| 2 h post opicapone | 3484 (20.6)* | 50 (30–50) | 331 035 (31.8)* |
| 24 h post opicapone | 3023 (34.0) | 30 (30–50) | 220 397 (17.1) |
| 3-OMD | |||
| 2 h post vehicle | 2694 (20) | 240 (130–310) | 590 308 (14.2) |
| 2 h post opicapone | 618 (84)* | 270 (−50–310) | 94 442 (123.5)* |
| 24 h post opicapone | 2026 (23) | 220 (170–310) | 371 880 (21.7)* |
Cmax and AUC are means with coefficient of variation (%).
*P < 0.05 by one-way anova followed by post hoc Dunnett's test. tmax values are median with range values.
Opicapone increased the bioavailability of levodopa by 1.9- and 1.3-fold, respectively, when given 2 and 24 h before levodopa/benserazide, and reduced 3-OMD bioavailability by 6.3- and 1.6-folds respectively. Levodopa Cmax values were increased by 1.6 and 1.4-fold, respectively, when opicapone was given 2 and 24 h before levodopa/benserazide. Tolcapone was tested under the same experimental conditions and the levodopa and 3-OMD disposition curves obtained are shown in Figure 4, with the pharmacokinetic parameters derived presented in Table 3.
Figure 4.
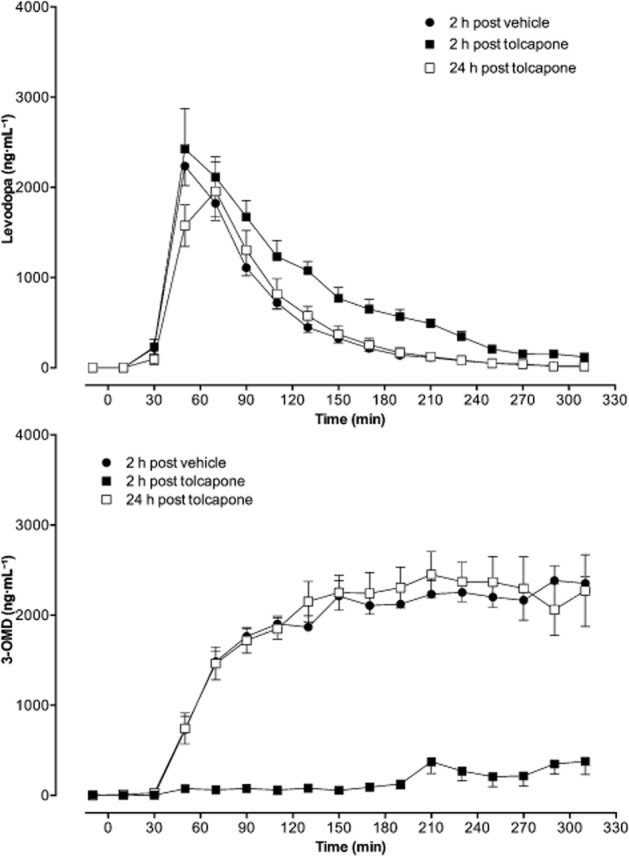
Levels of levodopa and 3-OMD in the bloodstream evaluated by means of microdialysis in the right jugular vein of rats administered 12 mg⋅kg−1 levodopa and 3 mg⋅kg−1 benserazide, p.o., on 3 consecutive days. On day 1 (vehicle), rats received vehicle 2 h before levodopa/benserazide. On day 2 (tolcapone), rats received opicapone 2 h before levodopa/benserazide. On day 3 (24 h post tolcapone), rats that were treated with tolcapone 24 h earlier, received vehicle 2 h before levodopa/benserazide. Dialysate samples were collected over 20 min periods starting at −150 min before levodopa/benserazide dosing until 310 min post-dose. Values are presented as mean ± SEM (n = 5–6) and were subtracted from their corresponding baseline values, calculated as the means of the samples collected before each levodopa/benserazide administration (from −150 to −10 min), to minimize inter day variability.
Table 3.
Pharmacokinetic parameters (Cmax, tmax and AUC) of systemic levodopa and 3-OMD following oral administration of levodopa/benserazide (12/3 mg⋅kg−1) after vehicle or 2 h or 24 h after 3 mg⋅kg−1 tolcapone
| Treatment period | Cmax (ng⋅mL−1) | tmax (min) | AUC (ng⋅min⋅mL−1) |
|---|---|---|---|
| Levodopa | |||
| 2 h post vehicle | 2324 (18.3) | 50 (50–70) | 150 362 (17.5) |
| 2 h post tolcapone | 2841 (28.6) | 50 (50–90) | 242 820 (20.7)* |
| 24 h post tolcapone | 2088 (37.9) | 70 (50–90) | 148 410 (44.7) |
| 3-OMD | |||
| 2 h post vehicle | 2630 (15.0) | 260 (150–310) | 531 994 (12.6) |
| 2 h post tolcapone | 788 (61.1)* | 220 (−150–310) | 53 066 (86.3)* |
| 24 h post tolcapone | 2873 (23.6) | 230 (210–310) | 522 900 (18.2) |
Cmax and AUC are means with coefficient of variation (%).
*P < 0.05 by one-way anova followed by post hoc Dunnett's test. tmax values are median with range values.
Tolcapone was only efficacious at increasing levodopa bioavailability (1.6-fold), levodopa Cmax (1.2-fold), and reducing 3-OMD bioavailability (10-fold) when given 2 h before levodopa/benserazide, showing no effects when given 24 h before levodopa/benserazide.
Opicapone effect on brain levodopa and metabolites
The effect of p.o. administered 3 mg⋅kg−1 opicapone or tolcapone was evaluated on brain catecholamines at 1, 2, 7, 12 and 24 h after administration of the compounds. One hour before being killed, all animals were given levodopa/benserazide (12/3 mg⋅kg−1) p.o. Tolcapone led to significantly increased levodopa levels at only 2 and 7 h post-administration (respectively 464 and 274% control values), while opicapone, although not inducing significant increases in the first 2 h, evoked sustained, increased levodopa levels (above 227% control values) up to 24 post-administration (Figure 5A). Similar results were observed for dihydroxphenylacetic acid (DOPAC) (Figure 5D). Regarding dopamine and homovanillic acid (HVA) no effects were observed with tolcapone treatment while with opicapone a modest, but significant increase in dopamine (Figure 5C) and HVA (Figure 5E) was observed. Regarding 3-OMD levels, tolcapone significantly reduced 3-OMD in the first 7 h with values completely recovered after 24 h while opicapone kept 3-OMD levels close to 50% control values from 2 h until 24 h after administration (Figure 5B).
Figure 5.

Effect of 3 mg⋅kg−1 opicapone and tolcapone on brain catecholamines. (A) Levodopa levels, (B) 3-OMD levels, (C) dopamine levels, (D) DOPAC levels and (E) HVA levels in rats administered, p.o., levodopa/benserazide (12/3 mg⋅kg−1). Brains were removed and levodopa, 3-OMD, dopamine, DOPAC and HVA were quantified in brain tissue. Results are mean ± SEM (n = 4–11). The absolute levels (means ± SEM) of all control values (n = 35) were for levodopa 0.5 ± 0.04 nmol⋅g−1; for 3-OMD 5.48 ± 0.2 nmol⋅g−1; for dopamine 1.98 ± 0.1 nmol⋅g−1; for DOPAC 1.05 ± 0.06 nmol⋅g−1 and for HVA 1.56 ± 0.07 nmol⋅g−1. Significantly different from corresponding control values (*P < 0.05).
Effect of nitrocatechol inhibitors upon viability of human cryopreserved hepatocytes
ATP is a marker for cell viability as it is present in all metabolically active cells. When cells undergo necrosis or apoptosis ATP concentration declines very rapidly. The ATP content of the human primary hepatocytes incubated 24 h with increasing concentrations of opicapone, entacapone or tolcapone was found decreased in a concentration-dependent manner (Figure 6A).
Figure 6.
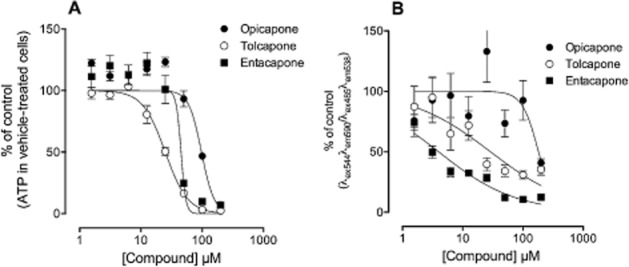
Potential cytotoxic effect of opicapone, entacapone and tolcapone. (A) Effect of the three compounds on cellular viability as evaluated by ATP quantification and (B) effect of the three compounds on the mitochondrial membrane potential. Human cryopreserved hepatocytes were incubated for 24 h with increasing concentrations of opicapone, entacapone and tolcapone after which ATP levels and the mitochondrial membrane potential were evaluated. Results, presented as % of control values, are mean ± SEM (n = 8).
Opicapone, entacapone and tolcapone decreased the ATP content of the cells with IC50 values of 98, 45 and 25 μM respectively.
Effect of nitrocatechol inhibitors upon mitochondrial membrane potential of human cryopreserved hepatocytes
Incubation of human primary hepatocytes for 24 h with increasing concentrations of tolcapone, entacapone or opicapone resulted in a concentration-dependent decrease in the mitochondrial membrane potential of the cells (Figure 6B), evaluated by the ratio JC-1 aggregates over JC-1 monomer (ratio λex544λem590 over λex485λem538). Opicapone, entacapone and tolcapone decreased the mitochondrial membrane potential of the cells with IC50 values of, respectively, 181, 4 and 29 μM.
Discussion
The purpose of this work was to characterize the pharmacological properties of opicapone in the rat, namely on the activity of COMT and on the pharmacokinetics of levodopa. Additionally, the study aimed at evaluating the potential cytotoxic effects of this compound in human cryopreserved hepatocytes using as comparators entacapone and tolcapone. Opicapone, proved to be a very long-acting and potent inhibitor of rat peripheral COMT, both of the hepatic and kidney enzymes, and although to a lesser extent, erythrocyte COMT, as translated by the prolonged inhibition of the enzyme, reaching close to control values only at 48 h post-administration, and also by the similar efficacy in enzyme inhibition at 2 and 6 h post-administration. The reason for the shorter inhibition observed in erythrocytes as compared with the other organs tested is not clear, it could be related to differences in membrane penetration as described for another nitrocatechol (Nissinen et al., 1988), and/or to the large difference in S-COMT activities among the organs, erythrocytes have about 10-fold lower S-COMT activity than liver S-COMT (Ellingson et al., 1999). It could be also related to the fact that erythrocytes mainly contain S-COMT, whereas the other organs express both S- and MB-COMT (Bonifácio et al., 2007).
The sustained COMT inhibition in the tissues was further evidenced by the microdialysis experiments where the effects of opicapone were compared with those of tolcapone, previously shown to be less efficacious than opicapone in inhibiting rat liver COMT at 3 h post-administration and with a shorter duration effect (Kiss et al., 2010). Twenty-four hours after opicapone administration, plasma 3-OMD bioavailability was still reduced by 1.6-fold as compared with the control situation (day 1) and levodopa was 1.3-fold increased, while tolcapone, 24 h after administration had no effect on plasma 3-OMD or levodopa bioavailabilities. Both compounds, however, when given 2 h before levodopa/benserazide, were similarly efficacious in increasing plasma levodopa bioavailability and reducing 3-OMD. The peripheral effects were correlated to the central effects observed. Tolcapone, when given up to 1 h before levodopa/benserazide, had a more pronounced effect than opicapone in increasing levodopa and DOPAC levels, and decreasing 3-OMD levels in the brain; however, the effect of tolcapone faded away with time and was lost when tolcapone was given 11 h before levodopa/benserazide. Regarding HVA, levels were not decreased by tolcapone, in contrast to that previously reported (Robinson et al., 2012), which could be due to the different dosages used, 10-fold lower in the present study. Opicapone, on the other hand, showed a less pronounced effect on levodopa and DOPAC increases and 3-OMD decrease when given in closer proximity to levodopa/benserazide administration, but the observed effect was maintained over time, to 24 h after administration. Furthermore, when opicapone was given 11 and 23 h before levodopa/benserazide, an increase in dopamine and HVA levels was also evident. This is consistent with the increase in DOPAC levels and no effect in brain COMT. These results are, basically, in agreement with those obtained from a microdialysis study performed in the monkey (Bonifácio et al., 2014), although direct comparisons cannot be made because of differences in sample origin (substantia nigra, prefrontal cortex and dorsal striatum) and collection methodology (microdialysis allows quantification of analytes in the extracellular space whereas in this study, catecholamines were quantified in brain tissue).
The results described here are in line with the data obtained in the initial development phase of the compound (Kiss et al., 2010) and further confirm the outstanding prolonged effect of opicapone in modulating brain catecholamine levels. This effect is particularly relevant for the levodopa adjunctive therapy of PD, as the development of motor complications is considered to be a consequence of fluctuating levodopa levels.
COMT inhibition in conjunction with the levodopa/aromatic amino acid decarboxylase inhibitor therapy results in more reduced levodopa concentration variations, as demonstrated by the use of entacapone and tolcapone in clinical practice; both compounds led to fewer fluctuations and a better motor response (Müller et al., 2006a, b; Muhlack et al., 2014) with tolcapone being more efficacious than entacapone; however, because of the potential hepatotoxicity of tolcapone, its use is limited (Marsala et al., 2012).
The prolonged inhibitory profile observed in the rat after opicapone administration, which has also been observed in other species, such as the cynomolgus monkey (Bonifácio et al., 2014), was not, however, a result of the presence of the compound in the circulation. The compound is very short lived in plasma, being completely metabolized 8 h after p.o. administration, similar to what is observed in humans. Opicapone, when administered to healthy volunteers in either single-dose or multiple-dose regimens, led to dose-independent and long-lasting inhibition of erythrocyte COMT activity, with a half-life of enzyme inhibition in the range 60–130 h, despite the short elimination half-life of the compound (Almeida et al., 2013; Rocha et al., 2013), and these effects were more marked than those reported for entacapone or tolcapone in healthy subjects. Maximal inhibitory effect (Emax) on COMT activity was 72 and 80% for 100 and 200 mg tolcapone, respectively (Dingemanse et al., 1995), and 65% for 200 mg entacapone (Keränen et al., 1994), with S-COMT activity returning to baseline approximately 18 h after tolcapone administration and 8 h after entacapone administration. On the other hand, COMT inhibition with opicapone, ranged from 36.6% (25 mg) to 57.2% (100 mg) at 24 h post-dose, and from 24.1% (25 mg) to 31.5% (100 mg) at 72 h post-dose. It was hypothesized that opicapone's dose-independent and long-lasting pharmacodynamic effect results from a long half-life of the reversible human COMT-opicapone complex (Palma et al., 2012, 2013). The tissue-dependent half-lives of rat COMT inhibition found in the present study are, however, significantly shorter. The reason for such differences have not been investigated, but the fact that the affinity of opicapone for the rat COMT is one order of magnitude lower than for the human enzyme will probably contribute to a decreased duration of the pharmacodynamic effect in the rodent species, compared with humans. The effect of opicapone (25, 50 and 75 mg once daily regimen) on the pharmacokinetics of levodopa has been studied in healthy subjects as compared with placebo and entacapone (200 mg thrice a day) (Rocha et al., 2014). As compared with placebo, all treatments substantially increased levodopa Cmin, without significantly changing levodopa Cmax, and significant increases in levodopa systemic exposure (AUC) were only observed for all opicapone treatments, but not with entacapone. As mentioned earlier, less levodopa toughs appear to be a prerequisite for more stable brain levodopa levels with the consequent better levodopa management of motor symptoms. Furthermore, it has been pointed out by Muhlack et al. (2014) that the timing of administration of levodopa is also a critical point to be taken into consideration in repeated dose regimens with COMT inhibitors; proper management of the dosing regimen can avert potential onset of peak dose dyskinesia. Opicapone, has the potential to be used in clinical practice in a once daily regimen at therapeutic doses expected to be 50 mg or lower, representing an advantage for compliance over other COMT inhibitors that have to be taken in several times per day (Rocha et al., 2014).
The development of new nitrocatechol-based COMT inhibitors raises safety concerns regarding hepatotoxicity as tolcapone, after introduction into the market, was associated with serious liver toxicity events, that restricted its usage (Olanow, 2000). Entacapone was never associated with liver toxicity, and although in the past 10 years no more severe liver toxicity cases were reported associated with tolcapone, the mechanism of tolcapone-induced liver toxicity is still unknown (Haasio, 2010). Therefore, the evaluation of potential hepatotoxicity risk of a new nitrocatechol COMT inhibitor is mandatory. In this study, opicapone was shown to be the compound least potent at decreasing both the mitochondrial membrane potential and the ATP content in human primary hepatocytes after a 24 h incubation period when compared with tolcapone or entacapone. Opicapone concentrations that caused 50% decrease in ATP content and mitochondrial membrane potential were, respectively, 98 μM (40.5 μg⋅mL−1) and 181 μM (74.8 μg⋅mL−1), which are, respectively, 78 and 143 times higher than the corresponding Cmax (522 ng⋅mL−1) at the highest therapeutic dose of 50 mg (Almeida et al., 2013) (Table 4).
Table 4.
Safety window of opicapone, entacapone and tolcapone with respect to ATP depletion (ATP depletion IC50/Cmax ratio) and MT (IC50/Cmax ratio) for the highest therapeutic doses
| Opicapone | Entacapone | Tolcapone | |
|---|---|---|---|
| Cmax | 522 ng⋅mL−1 | 1.8 μg⋅mL−1 | 6.3 μg⋅mL−1 |
| ATP depletion IC50 | 98 μM (40.5 μg⋅mL−1) | 45 μM (13.7 μg⋅mL−1) | 25 μM (6.8 μg⋅mL−1) |
| ATP depletion – IC50/Cmax | 77.5 | 7.6 | 1.1 |
| MT IC50 | 181 μM (74.8 μg⋅mL−1) | 4 μM (1.2 μg⋅mL−1) | 29 μM (7.9 μg⋅mL−1) |
| MT IC50/Cmax | 143.2 | 0.7 | 1.3 |
Cmax described for the highest therapeutic doses, 50 mg for opicapone, 200 mg for tolcapone and 200 mg for entacapone. Values in parenthesis are the concentrations calculated as μg⋅mL−1.
MT, mitochondrial toxicity.
Regarding tolcapone, it caused 50% decrease in ATP content and mitochondrial membrane potential at 25 μM (6.8 μg⋅mL−1) and 29 μM (7.9 μg⋅mL−1), which are, respectively, 1.1 and 1.3 times higher than the corresponding Cmax (6.3 μg⋅mL−1) at the therapeutic dose of 200 mg (Dingemanse et al., 1995) (Table 4). Entacapone depleted ATP with an IC50 of 45 μM (13.7 μg⋅mL−1), and decreased the mitochondrial membrane potential with an IC50 of 4 μM (1.2 μg⋅mL−1), respectively, 7.6 and 0.7 times higher than the corresponding Cmax (1.8 μg⋅mL−1) for the therapeutic dose of 200 mg (Keränen et al., 1994) (Table 4). Based on these values, the safety margin of opicapone, taking into consideration ATP depletion and mitochondrial membrane potential alteration, respectively, is vastly superior to tolcapone and even to entacapone, for which there is no evidence of liver toxicity.
Conclusions
Opicapone has remarkable properties, not present in the currently available COMT inhibitors, namely a prolonged inhibitory profile on peripheral COMT, resulting in a sustained and extended increased peripheral and central bioavailability of levodopa with concomitant 3-OMD reduction with no toxic effects. Opicapone presents a pharmacodynamic profile adequate for a once daily regimen that can offer an advantage in improving treatment.
Acknowledgments
This study was sponsored by BIAL-Portela & Ca, S.A.
Glossary
- 3-OMD
3-O-methyldopa
- COMT
catechol-O-methyltransferase
- FCCP
carbonyl cyanide-p-trifluoromethoxyphenylhydrazone
- HBSS
Hank's balanced salt solution
- JC-1
5,5′,6,6′-tetrachloro-1,1′,3,3′-tetraethyl-imidacarbocyanine iodide
- levodopa
L-3,4-dihydroxyphenylalanine
- PCA
perchloric acid
- PD
Parkinson's disease
Author contributions
M. J. B. and P. S. S. did study conception and design. L. T., A. I. L. and M. J. B. performed experiments and did data acquisition. M. J. B., L. T., A. I. L. and P. N. P. analysed and interpreted the data. M. J. B., P. N. P. and P. S. S. drafted the paper. A. I. L., L. C. W. and P. S. S. did critical revision.
Conflict of interest
All authors were involved in the design or conduct of the study, the collection, management or analysis of the data, and the preparation or review of the paper. Drs Maria João Bonifácio, Leonel Torrão, Ana Loureiro, Nuno Palma, Lyndon C. Wright and Patrício Soares-da-Silva are or were employees of BIAL-Portela & Ca, S.A at the time of the study.
References
- Alexander SPH, Benson HE, Faccenda E, Pawson AJ, Sharman JL, Spedding M, et al. The Concise Guide to PHARMACOLOGY 2013/14: Enzymes. Br J Pharmacol. 2013;170:1797–1867. doi: 10.1111/bph.12451. [DOI] [PMC free article] [PubMed] [Google Scholar]
- Almeida L, Rocha JF, Falcão A, Palma PN, Loureiro AI, Pinto R, et al. Pharmacokinetics, pharmacodynamics and tolerability of opicapone, a novel catechol-O-methyltransferase inhibitor, in healthy subjects: prediction of slow enzyme-inhibitor complex dissociation of a short-living and very long-acting inhibitor. Clin Pharmacokinet. 2013;52:139–151. doi: 10.1007/s40262-012-0024-7. [DOI] [PubMed] [Google Scholar]
- Bonifácio MJ, Vieira-Coelho MA, Soares-da-Silva P. Kinetic inhibitory profile of BIA 3–202, a novel fast tight-binding, reversible and competitive catechol-O-methyltransferase inhibitor. Eur J Pharmacol. 2003;460:163–170. doi: 10.1016/s0014-2999(02)02879-0. [DOI] [PubMed] [Google Scholar]
- Bonifácio MJ, Palma PN, Almeida L, Soares-da-Silva P. Catechol-O-methyltransferase and its inhibitors in Parkinson's disease. CNS Drug Rev. 2007;13:352–379. doi: 10.1111/j.1527-3458.2007.00020.x. [DOI] [PMC free article] [PubMed] [Google Scholar]
- Bonifácio MJ, Sutcliffe JS, Torrão L, Wright LC, Soares-da-Silva P. Brain and peripheral pharmacokinetics of levodopa in the cynomolgus monkey following administration of opicapone, a third generation nitrocatechol COMT inhibitor. Neuropharmacology. 2014;77:334–341. doi: 10.1016/j.neuropharm.2013.10.014. [DOI] [PubMed] [Google Scholar]
- Brooks DJ. Safety and tolerability of COMT inhibitors. Neurology. 2004;62(1 Suppl. 1):S39–S46. doi: 10.1212/wnl.62.1_suppl_1.s39. [DOI] [PubMed] [Google Scholar]
- Dingemanse J, Jorga KM, Schmitt M, Gieschke R, Fotteler B, Zürcher G, et al. Integrated pharmacokinetics and pharmacodynamics of the novel catechol-O-methyltransferase inhibitor tolcapone during first administration to humans. Clin Pharmacol Ther. 1995;57:508–517. doi: 10.1016/0009-9236(95)90035-7. [DOI] [PubMed] [Google Scholar]
- Ellingson T, Duddempudi S, Greenberg BD, Hooper D, Eisenhofer G. Determination of differential activities of soluble and membrane-bound catechol-O-methyltransferase in tissues and erythrocytes. J Chromatogr B Biomed Sci Appl. 1999;729:347–353. doi: 10.1016/s0378-4347(99)00125-5. [DOI] [PubMed] [Google Scholar]
- Ferreira JJ, Rocha JF, Santos A, Nunes T, Soares-da-Silva P. The design of a double-blind, placebo- and active-controlled, multi-national phase-III trial in patients with Parkinson's disease and end-of-dose motor fluctuations: opicapone superiority vs. placebo and non-inferiority vs. entacapone. Mov Disord. 2012;27(Suppl. 1):S118. [Google Scholar]
- Guldberg HC, Marsden CA. Catechol-O-methyltransferase: pharmacological aspects and physiological role. Pharmacol Rev. 1975;27:135–206. [PubMed] [Google Scholar]
- Haasio K. Toxicology and safety of COMT inhibitors. Int Rev Neurobiol. 2010;95:163–189. doi: 10.1016/B978-0-12-381326-8.00007-7. [DOI] [PubMed] [Google Scholar]
- Kaakkola S. Problems with the present inhibitors and a relevance of new and improved COMT inhibitors in Parkinson's disease. Int Rev Neurobiol. 2010;95:207–225. doi: 10.1016/B978-0-12-381326-8.00009-0. [DOI] [PubMed] [Google Scholar]
- Karhunen T, Tilgmann C, Ulmanen I, Julkunen I, Panula P. Distribution of catechol-O-methyltransferase enzyme in rat tissues. J Histochem Cytochem. 1994;42:1079–1090. doi: 10.1177/42.8.8027527. [DOI] [PubMed] [Google Scholar]
- Keating GM, Lyseng-Williamson KA. Tolcapone: a review of its use in the management of Parkinson's disease. CNS Drugs. 2005;19:165–184. doi: 10.2165/00023210-200519020-00006. [DOI] [PubMed] [Google Scholar]
- Keränen T, Gordin A, Karlsson M, Korpela K, Pentikäinen PJ, Rita H, et al. Inhibition of soluble catechol-O-methyltransferase and single-dose pharmacokinetics after oral and intravenous administration of entacapone. Eur J Clin Pharmacol. 1994;46:151–157. doi: 10.1007/BF00199880. [DOI] [PubMed] [Google Scholar]
- Kilkenny C, Browne W, Cuthill IC, Emerson M, Altman DG. Animal research: reporting in vivo experiments: the ARRIVE guidelines. Br J Pharmacol. 2010;160:1577–1579. doi: 10.1111/j.1476-5381.2010.00872.x. [DOI] [PMC free article] [PubMed] [Google Scholar]
- Kiss LE, Ferreira HS, Torrão L, Bonifácio MJ, Palma PN, Soares-da-Silva P, et al. Discovery of a long-acting, peripherally selective inhibitor of catechol-O-methyltransferase. J Med Chem. 2010;53:3396–3411. doi: 10.1021/jm1001524. [DOI] [PubMed] [Google Scholar]
- Lees AJ. Evidence-based efficacy comparison of tolcapone and entacapone as adjunctive therapy in Parkinson's disease. CNS Neurosci Ther. 2008;14:83–93. doi: 10.1111/j.1527-3458.2007.00035.x. [DOI] [PMC free article] [PubMed] [Google Scholar]
- Marsala SZ, Gioulis M, Ceravolo R, Tinazzi M. A systematic review of catechol-O-methyltransferase inhibitors: efficacy and safety in clinical practice. Clin Neuropharmacol. 2012;35:185–190. doi: 10.1097/WNF.0b013e31825c034a. [DOI] [PubMed] [Google Scholar]
- McGrath J, Drummond G, McLachlan E, Kilkenny C, Wainwright C. Guidelines for reporting experiments involving animals: the ARRIVE guidelines. Br J Pharmacol. 2010;160:1573–1576. doi: 10.1111/j.1476-5381.2010.00873.x. [DOI] [PMC free article] [PubMed] [Google Scholar]
- Muhlack S, Herrmann L, Salmen S, Müller T. Fewer fluctuations, higher maximum concentration and better motor response of levodopa with catechol-O-methyltransferase inhibition. J Neural Transm. 2014;121:1357–1366. doi: 10.1007/s00702-014-1213-3. [DOI] [PubMed] [Google Scholar]
- Müller T, Erdmann C, Muhlack S, Bremen D, Przuntek H, Goetze O, et al. Pharmacokinetic behaviour of levodopa and 3-O-methyldopa after repeat administration of levodopa/carbidopa with and without entacapone in patients with Parkinson's disease. J Neural Transm. 2006a;113:1441–1448. doi: 10.1007/s00702-006-0442-5. [DOI] [PubMed] [Google Scholar]
- Müller T, Erdmann C, Muhlack S, Bremen D, Przuntek H, Woitalla D. Inhibition of catechol-O-methyltransferase contributes to more stable levodopa plasma levels. Mov Disord. 2006b;21:332–336. doi: 10.1002/mds.20717. [DOI] [PubMed] [Google Scholar]
- Nissinen E, Linden IB, Schultz E, Kaakkola S, Mannisto PT, Pohto P. Inhibition of catechol-O-methyltransferase activity by two novel disubstituted catechols in the rat [published erratum appears in Eur J Pharmacol 1988 Nov 22; 157 (2–3): 244] Eur J Pharmacol. 1988;153:263–269. doi: 10.1016/0014-2999(88)90614-0. [DOI] [PubMed] [Google Scholar]
- Olanow CW. Tolcapone and hepatotoxic effects. Arch Neurol. 2000;57:263–267. doi: 10.1001/archneur.57.2.263. [DOI] [PubMed] [Google Scholar]
- Olanow CW, Schapira AH. Therapeutic prospects for Parkinson disease. Ann Neurol. 2013;74:337–347. doi: 10.1002/ana.24011. [DOI] [PubMed] [Google Scholar]
- Palma PN, Bonifácio MJ, Loureiro AI, Soares-da-Silva P. Computation of the binding affinities of catechol-O-methyltransferase inhibitors: multisubstate relative free energy calculations. J Comput Chem. 2012;33:970–986. doi: 10.1002/jcc.22926. [DOI] [PubMed] [Google Scholar]
- Palma PN, Kiss LE, Soares-da-Silva P. Catechol-O-methyl-transferase inhibitors: present problems and relevance of the new ones. In: Martinez A, Gil C, editors. Emerging Drugs and Targets for Parkinson's Disease. Vol. 34. Cambridge: Royal Society of Chemistry; 2013. pp. 83–109. [Google Scholar]
- Pawson AJ, Sharman JL, Benson HE, Faccenda E, Alexander SP, Buneman OP, et al. NC-IUPHAR. The IUPHAR/BPS Guide to PHARMACOLOGY: an expert-driven knowledgebase of drug targets and their ligands. Nucl Acids Res. 2014;42(Database Issue):D1098-106. doi: 10.1093/nar/gkt1143. [DOI] [PMC free article] [PubMed] [Google Scholar]
- Robinson RG, Smith SM, Wolkenberg SE, Kandebo M, Yao L, Gibson CR, et al. Characterization of non-nitrocatechol pan and isoform specific catechol-O-methyltransferase inhibitors and substrates. ACS Chem Neurosci. 2012;3:129–140. doi: 10.1021/cn200109w. [DOI] [PMC free article] [PubMed] [Google Scholar]
- Rocha JF, Almeida L, Falcão A, Palma PN, Loureiro AI, Pinto R, et al. Opicapone: a short lived and very long acting novel catechol-O-methyltransferase inhibitor following multiple-dose administration in healthy subjects. Br J Clin Pharmacol. 2013;76:763–775. doi: 10.1111/bcp.12081. [DOI] [PMC free article] [PubMed] [Google Scholar]
- Rocha JF, Falcão A, Santos A, Pinto R, Lopes N, Nunes T, et al. Effect of opicapone and entacapone upon levodopa pharmacokinetics during three daily levodopa administrations. Eur J Clin Pharmacol. 2014;70:1059–1071. doi: 10.1007/s00228-014-1701-2. [DOI] [PubMed] [Google Scholar]
- Rodriguez-Oroz MC, Marin C, de Fabregues O. Continuous dopaminergic stimulation: clinical aspects and experimental bases. Neurologist. 2011;17(6 Suppl. 1):S30–S37. doi: 10.1097/NRL.0b013e31823966e3. [DOI] [PubMed] [Google Scholar]