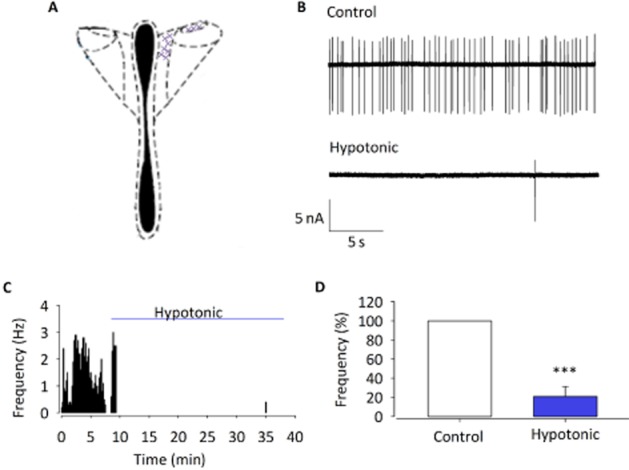
Figure 1.

The effect of osmolality changes on ACf. Cell-attached action current measurements in slice recorded from location shown in (A). (B) Raw action current trace at 300 mOsm (control) and 270 mOsm (hypotonic challenge). (C) Representative frequency histogram showing action current response to hypotonic challenge of a single parvocellular neurone. (D) Percent normalized ACf forexperiments similar to those illustrated in (A) and (B) (normalized to ACf during control conditions) is significantly reduced. Data shown are means±SEM (n=10). ***P < 0.001, signficantly different from control.
