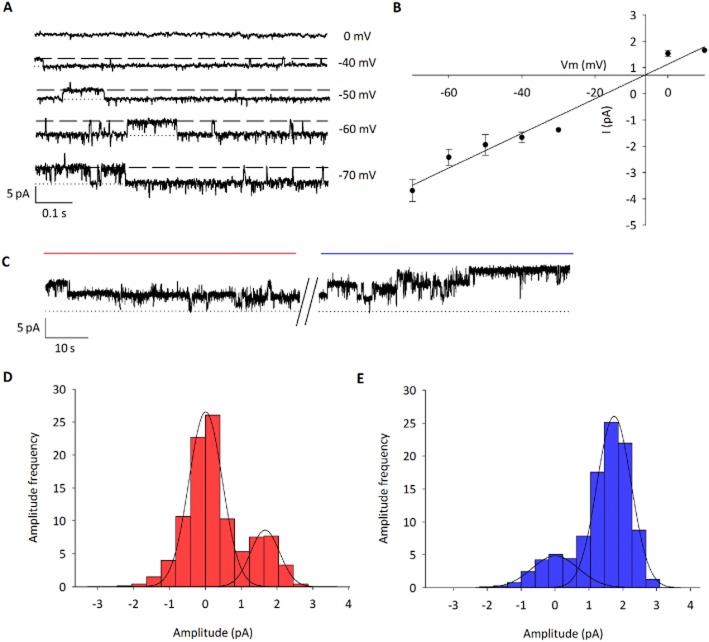
Figure 3.
Single channel identification of the 4αPDD-activated channel. (A) Representative single-channel recordings in cell-attached patch clamp (dashed line represents open state). Channel activity was seen in 50% of patches (8/16). (B) IV curve shows mean slope unitary conductance of 57 ± 7 pS and reversal potential of −5 ± 3 mV (n = 6); indicative of a non-selective cation channel. (C) Representative single channel recordings before (red line) and after (blue line) 4αPDD at −40 mV. (D) Representative amplitude histogram before and (E) after addition of 4αPDD at −40 mV. P0 increased by 48 ± 9% (n = 4; P < 0.001) upon addition of 4αPDD (for kinetic analysis, see the Supporting Information).

