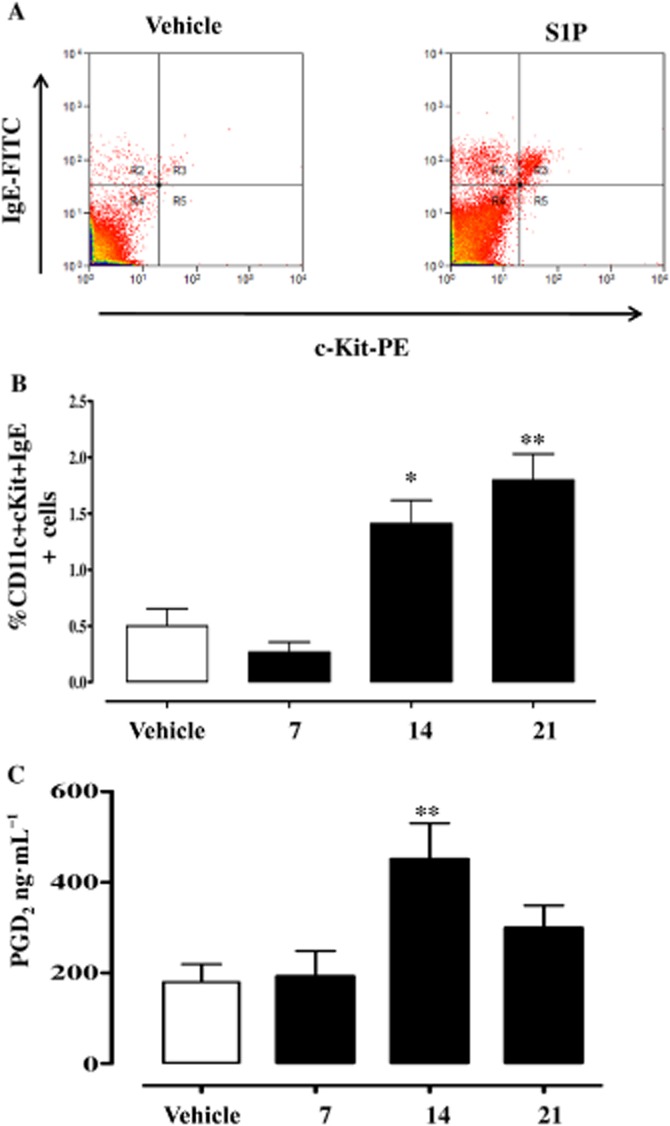
Figure 2.

S1P increases mast cell infiltration in the lung. (A) Mast cells were identified as IgE+cKit+ cells by flow cytometry as shown in the representative dot plot. (B) Mast cell infiltration was quantified after 7, 14 and 21 days following S1P administration. (C) Sera were collected and PGD2 levels were determined by using specific elisa. *P < 0.05, **P < 0.01 versus vehicle. Data are means ± SEM n = 6 mice in each group.
