
Fig. 12.
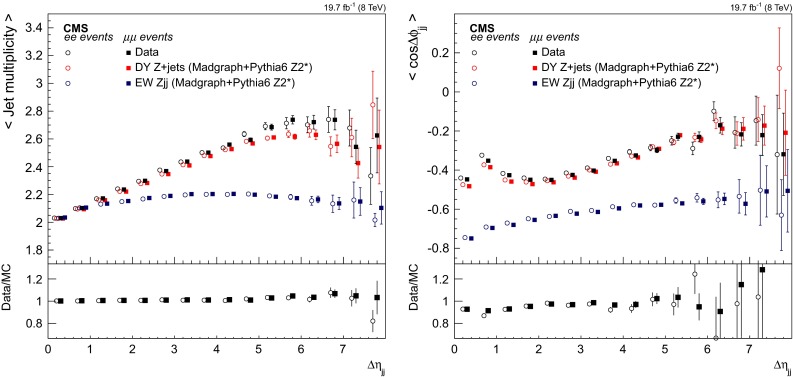
(Left) The average number of jets with as a function of the pseudorapidity distance between the dijet with largest , and (right) average as a function of between the dijet with largest . In both cases events containing a and at least two jets are used. The ratios of data to expectation are given below the main panels. At each ordinate, the entries are separated for clarity. The expectations for are shown separately. The data and simulation points are shown with their statistical uncertainties